Stat 401 B – Lecture 26 Forward Selection
advertisement
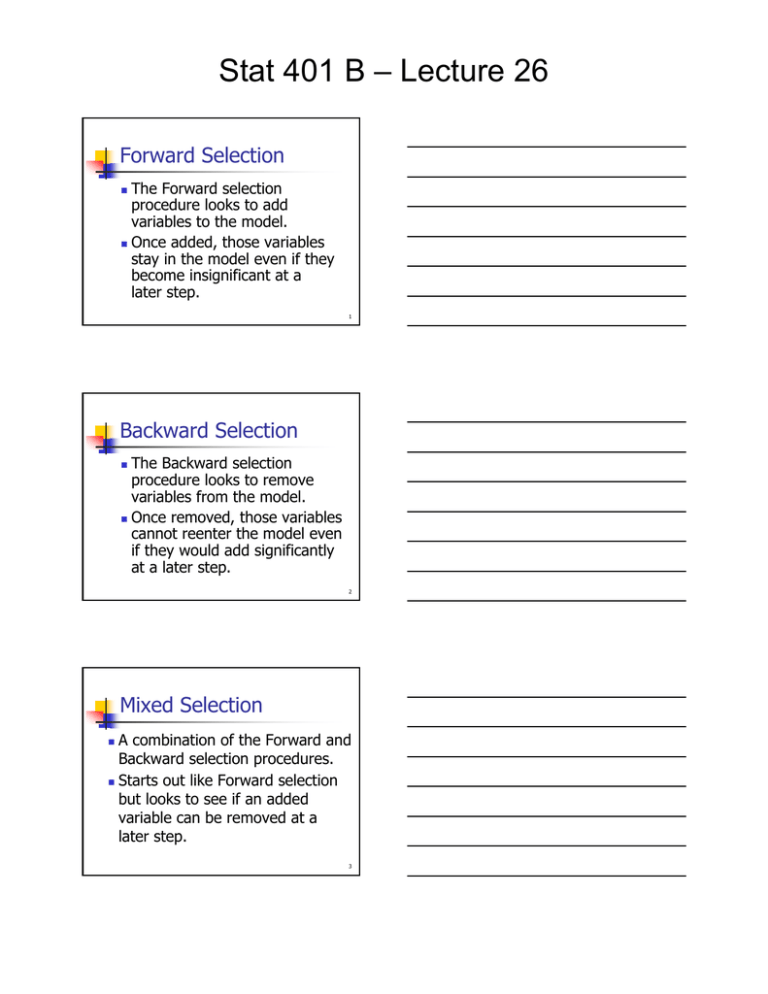
Stat 401 B – Lecture 26 Forward Selection The Forward selection procedure looks to add variables to the model. Once added, those variables stay in the model even if they become insignificant at a later step. 1 Backward Selection The Backward selection procedure looks to remove variables from the model. Once removed, those variables cannot reenter the model even if they would add significantly at a later step. 2 Mixed Selection A combination of the Forward and Backward selection procedures. Starts out like Forward selection but looks to see if an added variable can be removed at a later step. 3 Stat 401 B – Lecture 26 Mixed – Set up Stepwise Fit Response: MDBH Stepwise Regression Control Prob to Enter Prob to Leave 0.250 0.250 Direction: Mixed Current Estimates SSE 10.3855 DFE MSE RSquare RSquare Adj 19 0.5466053 0.0000 0.0000 Lock Entered Parameter Intercept X1 X2 X3 Estimate 6.265 0 0 0 Cp 102.4885 AIC -11.1064 nDF SS "F Ratio" "Prob>F" 1 0 0.000 1.0000 1 6.207045 26.739 0.0001 1 0.616027 1.135 0.3008 1 7.335255 43.287 0.0000 Step History Step Parameter Action "Sig Prob" Seq SS RSquare Cp p 4 Stepwise Regression Control Direction – Mixed Prob to Enter – controls what variables are added. Prob to Leave – controls what variables are removed. Prob to Enter = Prob to Leave 5 Current Estimates The current estimates are exactly the same as with the Forward selection procedure. Clicking on Step will initiate the Mixed procedure that starts like the Forward procedure. 6 Stat 401 B – Lecture 26 Stepwise Fit Response: MDBH Stepwise Regression Control Prob to Enter Prob to Leave 0.250 0.250 Direction: Mixed Current Estimates SSE 3.0502449 DFE MSE RSquare RSquare Adj Cp 18 0.1694581 0.7063 0.6900 19.387747 Lock Entered Parameter Intercept X1 X2 X3 Estimate 3.8956688 0 0 32.9371533 AIC -33.6102 nDF SS "F Ratio" "Prob>F" 1 0 0.000 1.0000 1 1.000159 8.294 0.0104 1 0.403296 2.590 0.1259 1 7.335255 43.287 0.0000 Step History Step 1 Parameter X3 Action Entered "Sig Prob" Seq SS RSquare Cp 0.0000 7.335255 0.7063 19.388 p 2 7 Current Estimates – Step 1 X3 is added to the model Predicted MDBH = 3.896 + 32.937*X3 R2=0.7063 MSE = 0.1694581 = 0.4117 RMSE = 8 Current Estimates – Step 1 By clicking on Step you will invoke the Backward part of the Mixed procedure. Because X3 is statistically significant and is the only variable in the model, clicking on Step will not do anything. 9 Stat 401 B – Lecture 26 Current Estimates – Step 1 Of the remaining variables not in the model X1 will add the largest sum of squares if added to the model. SS = 1.000 “F Ratio” = 8.294 “Prob>F” =0.0104 10 JMP Mixed – Step 2 Because X1 will add the largest sum of squares and that addition is statistically significant, by clicking on Step, JMP will add X1 to the model with X3. 11 Stepwise Fit Response: MDBH Stepwise Regression Control Prob to Enter Prob to Leave 0.250 0.250 Direction: Mixed Current Estimates SSE 2.0500859 DFE MSE RSquare RSquare Adj Cp 17 0.1205933 0.8026 0.7794 9.7842935 Lock Entered Parameter Intercept X1 X2 X3 AIC -39.557 Estimate nDF SS "F Ratio" "Prob>F" 3.14321066 1 0 0.000 1.0000 0.03136639 1 1.000159 8.294 0.0104 0 1 0.670967 7.784 0.0131 22.953752 1 2.128369 17.649 0.0006 Step History Step 1 2 Parameter X3 X1 Action Entered Entered "Sig Prob" Seq SS RSquare Cp 0.0000 7.335255 0.7063 19.388 0.0104 1.000159 0.8026 9.7843 p 2 3 12 Stat 401 B – Lecture 26 Current Estimates – Step 2 X1 is added to the model Predicted MDBH = 3.143 + 0.0314*X1 + 22.954*X3 R2=0.8026 MSE = 0.1205933 = 0.3473 RMSE = 13 Current Estimates – Step 2 By clicking on Step you will invoke the Backward part of the Mixed procedure. Because X3 and X1 are statistically significant, clicking on Step will not do anything. 14 Current Estimates – Step 2 Of the remaining variables not in the model X2 will add the largest sum of squares if added to the model. SS = 0.671 “F Ratio” = 7.784 “Prob>F” =0.0131 15 Stat 401 B – Lecture 26 JMP Mixed – Step 3 Because X2 will add the largest sum of squares and that addition is statistically significant, by clicking on Step, JMP will add X2 to the model with X3 and X1. 16 Stepwise Fit Response: MDBH Stepwise Regression Control Prob to Enter Prob to Leave 0.250 0.250 Direction: Mixed Current Estimates SSE 1.3791191 DFE MSE RSquare RSquare Adj 16 0.0861949 0.8672 0.8423 Lock Entered Parameter Intercept X1 X2 X3 Cp 4 AIC -45.4857 Estimate nDF SS "F Ratio" "Prob>F" 3.23573225 1 0 0.000 1.0000 0.09740562 1 1.26783 14.709 0.0015 -0.0001689 1 0.670967 7.784 0.0131 3.46681347 1 0.014774 0.171 0.6844 Step History Step 1 2 3 Parameter X3 X1 X2 Action Entered Entered Entered "Sig Prob" Seq SS RSquare Cp 0.0000 7.335255 0.7063 19.388 0.0104 1.000159 0.8026 9.7843 0.0131 0.670967 0.8672 4 p 2 3 4 17 Current Estimates – Step 3 X2 is added to the model Predicted MDBH = 3.236 + 0.0974*X1 – 0.000169*X2 + 3.467*X3 R2=0.8672 RMSE = MSE = 0.0861949 = 0.2936 18 Stat 401 B – Lecture 26 Current Estimates – Step 3 By clicking on Step you will invoke the Backward part of the Mixed procedure. Note that variable X3 is no longer statistically significant and so it will be removed from the model when you click on Step. 19 Stepwise Fit Response: MDBH Stepwise Regression Control Prob to Enter Prob to Leave 0.250 0.250 Direction: Mixed Current Estimates SSE 1.3938931 DFE MSE RSquare RSquare Adj Cp 17 0.0819937 0.8658 0.8500 2.1714023 Lock Entered Parameter Intercept X1 X2 X3 AIC -47.2726 Estimate nDF SS "F Ratio" "Prob>F" 3.26051366 1 0 0.000 1.0000 0.10691347 1 8.37558 102.149 0.0000 -0.0001898 1 2.784561 33.961 0.0000 0 1 0.014774 0.171 0.6844 Step History Step 1 2 3 4 Parameter X3 X1 X2 X3 Action "Sig Prob" Seq SS RSquare Cp Entered 0.0000 7.335255 0.7063 19.388 Entered 0.0104 1.000159 0.8026 9.7843 Entered 0.0131 0.670967 0.8672 4 Removed 0.6844 0.014774 0.8658 2.1714 p 2 3 4 3 20 Current Estimates – Step 4 X3 is removed from the model Predicted MDBH = 3.2605 + 0.1069*X1 – 0.0001898*X2 R2=0.8658 RMSE = MSE = 0.0819937 = 0.2863 21 Stat 401 B – Lecture 26 Current Estimates – Step 4 Because X1 and X2 add significantly to the model they cannot be removed. Because X3 will not add significantly to the model it cannot be added. The Mixed procedure stops. 22 Response MDBH Summary of Fit RSquare RSquare Adj Root Mean Square Error Mean of Response Observations (or Sum Wgts) 0.865785 0.849995 0.286345 6.265 20 Analysis of Variance Source Model Error C. Total DF 2 17 19 Sum of Squares Mean Square 4.49580 8.991607 0.08199 1.393893 10.385500 F Ratio 54.8311 Prob > F <.0001* Parameter Estimates Term Intercept X1 X2 Estimate Std Error t Ratio Prob>|t| 3.2605137 0.333024 9.79 <.0001* 0.1069135 0.010578 10.11 <.0001* -0.00019 3.256e-5 -5.83 <.0001* Effect Tests Source X1 X2 Nparm 1 1 DF 1 1 Sum of Squares F Ratio Prob > F 8.3755800 102.1490 <.0001* 2.7845615 33.9607 <.0001* 23 Finding the “best” model For this example, the Forward selection procedure did not find the “best” model. The Backward and Mixed selection procedures came up with the “best” model. 24 Stat 401 B – Lecture 26 Finding the “best” model None of the automatic selection procedures are guaranteed to find the “best” model. The only way to be sure, is to look at all possible models. 25 All Possible Models For k explanatory variables there k are 2 − 1 possible models. There are k 1-variable models. ⎛ k ⎞ There are ⎜ ⎟⎟ 2-variable models. ⎜ ⎝ 2 There are ⎛⎜⎜ k ⎝ 3 ⎠ ⎞ ⎟⎟ 3-variable ⎠ models. 26 All Possible Models When confronted with all possible models, we often rely on summary statistics to describe features of the models. R2 adjR2 RMSE 27 Stat 401 B – Lecture 26 All Possible Models Another summary statistic used to assess the fit of a model is Mallows Cp. ⎛ SSE p C p = ⎜⎜ ⎝ MSEFull p = k +1 ⎞ ⎟⎟ − (n − 2 p ) ⎠ 28 All Possible Models The smaller Cp is the “better” the fit of the model. The full model will have Cp=p. 29 JMP – Fit Model Personality – Stepwise Red triangle pull down – All Possible Models Right click on table – Columns Check Cp 30 Stat 401 B – Lecture 26 Stepwise Fit Response: MDBH All Possible Models Model Number RSquare 3 0.8672 X1,X2,X3 2 0.8658 X1,X2 2 0.8026 X1,X3 2 0.7451 X2,X3 1 0.7063 X3 1 0.5977 X1 1 0.0593 X2 RMSE 0.2936 0.2863 0.3473 0.3946 0.4117 0.4818 0.7367 Cp 4.0000 2.1714 9.7843 16.7089 19.3877 32.4768 97.3416 0.9 0.8 0.7 RMSE 0.6 0.5 X3 0.4 0.3 X1,X2 X1,X2,X3 0.2 0.1 1 2 3 4 5 6 p = Number of Terms 31 All Possible Models Lists all 7 models. 3-variable (full) model first. 2-variable models – listed in order of the R2 value. 1-variable models – listed in order of the R2 value. 32 All Possible Models Model with X1, X2, X3 – Highest R2 value. Model with X1, X2 – Lowest RMSE and lowest Cp. Which is “best”? Can’t tell until you look at significance of the variables in the model. 33
