Stat 301 – Lecture 1 First Day The Big Picture
advertisement
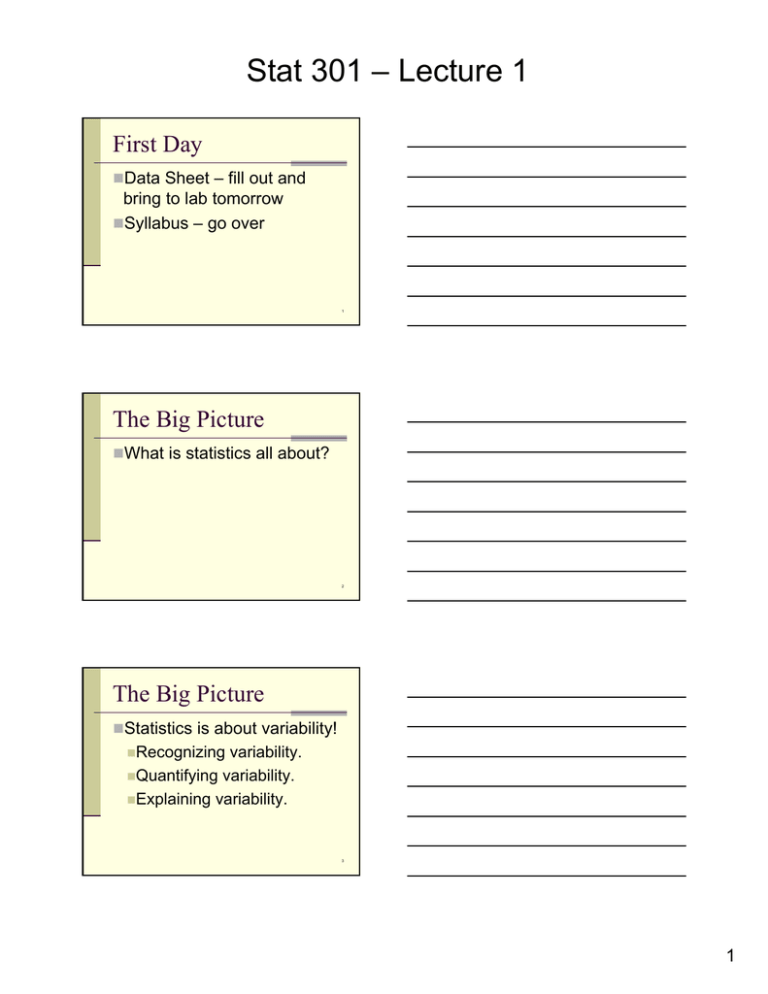
Stat 301 – Lecture 1 First Day Data Sheet – fill out and bring to lab tomorrow Syllabus – go over 1 The Big Picture What is statistics all about? 2 The Big Picture Statistics is about variability! Recognizing variability. Quantifying variability. Explaining variability. 3 1 Stat 301 – Lecture 1 Statistical Thinking An appreciation of uncertainty and variability and their impact on decision making. Using the scientific method when approaching issues and problems. 4 Statistical Thinking Starts with a question – Did cars and trucks made in 2004 meet the Corporate Average Fuel Economy (CAFE) standard? 5 Statistical Thinking What data would help us answer this question? 6 2 Stat 301 – Lecture 1 Parameter – numerical summary of the entire population. Population – all items of interest. Example: All vehicles made In 2004. Example: population mean fuel economy (MPG). Sample – a few items from the population. Example: 36 vehicles. Statistic – numerical summary of the sample. Example: sample mean fuel economy (MPG). 7 Sampling Random selection from the population of interest. The lab tomorrow will look at what happens with “purposeful” sampling and random sampling. 8 A Word of Caution Statistical methods are very good at quantifying uncertainty introduced by random sampling. Statistics doesn’t help much if the population changes with time. 9 3 Stat 301 – Lecture 1 Political Opinion Poll Over 800 randomly selected registered voters are asked: “If the 2016 presidential election were held today, whom would you support if the candidates are Hillary Clinton, the Democrat, and Chris Christie, the Republican?” 10 Political Opinion Poll The sample proportion indicating they would vote for Christie or Clinton is a pretty good indication (within 3.5 percentage points) of the true proportion of the population of voters. 11 Political Opinion Poll Does that mean that this poll predicts the outcome of the presidential election in November of 2016? 12 4
