Statistics 104 Solutions to Sample problems for Chapter 10 Problem:
advertisement
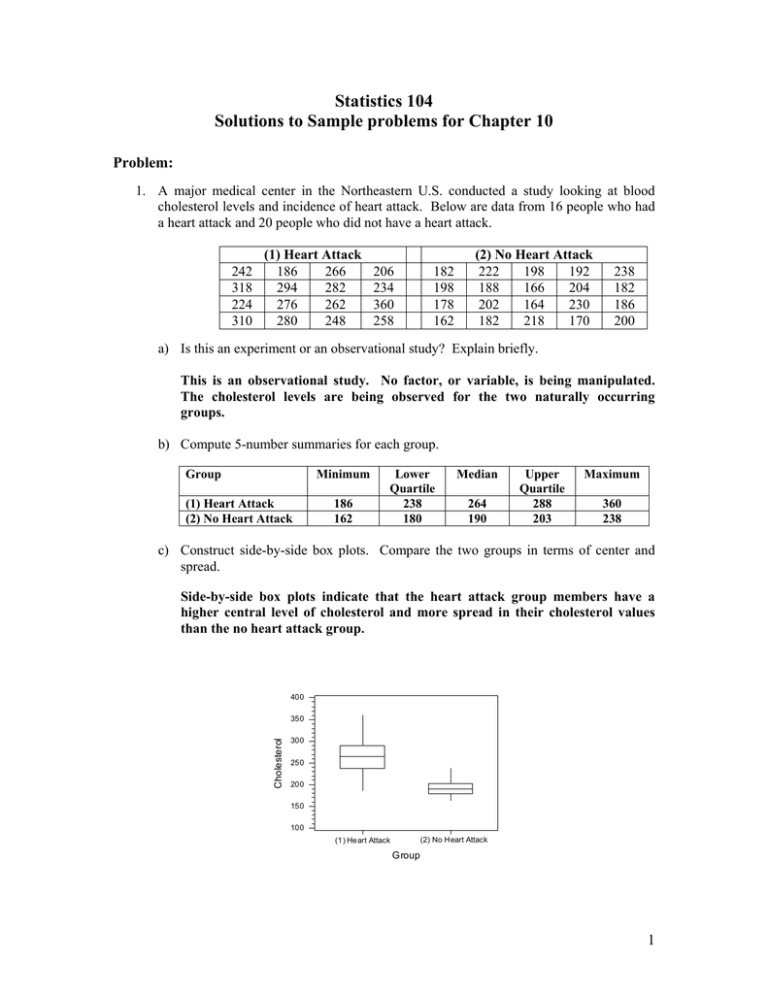
Statistics 104 Solutions to Sample problems for Chapter 10 Problem: 1. A major medical center in the Northeastern U.S. conducted a study looking at blood cholesterol levels and incidence of heart attack. Below are data from 16 people who had a heart attack and 20 people who did not have a heart attack. 242 318 224 310 (1) Heart Attack 186 266 294 282 276 262 280 248 206 234 360 258 182 198 178 162 (2) No Heart Attack 222 198 192 188 166 204 202 164 230 182 218 170 238 182 186 200 a) Is this an experiment or an observational study? Explain briefly. This is an observational study. No factor, or variable, is being manipulated. The cholesterol levels are being observed for the two naturally occurring groups. b) Compute 5-number summaries for each group. Group Minimum (1) Heart Attack (2) No Heart Attack 186 162 Lower Quartile 238 180 Median 264 190 Upper Quartile 288 203 Maximum 360 238 c) Construct side-by-side box plots. Compare the two groups in terms of center and spread. Side-by-side box plots indicate that the heart attack group members have a higher central level of cholesterol and more spread in their cholesterol values than the no heart attack group. 400 Cholesterol 350 300 250 200 150 100 (2) No Heart Attack (1) Heart Attack Group 1 d) Describe how the individuals in the study need to be selected in order for the randomization condition to be met. The 16 individuals should be selected at random from a population of individuals who have experienced heart attacks. The 20 individuals should be selected at random from a population of individuals who have not experienced a heart attack. Below are summary statistics for the two groups. (1) Heart Attack (2) No Heart Attack y1 265.375 s1 43.645 n1 16 y2 193.1 s2 21.623 n2 20 e) Is there sufficient evidence to indicate that the mean cholesterol for people who have had a heart attack is greater than that for people who have not had a heart attack? Perform the appropriate test of hypothesis. Use df = 20 and α=0.05. Note: the normal distribution condition is satisfied. H 0 : 1 2 H A : 1 2 t y1 y2 0 s12 s22 n1 n2 265.375 193.1 43.6452 21.6232 16 72.275 6.056 11.9345 20 Using Table T and 20 degrees of freedom, the one tail probability (P-value) is less than 0.001. Because the P-value is so small, we reject the null hypothesis. People who have had a heart attack have a population mean cholesterol level that is higher than that of people who have not had a heart attack. f) Construct a 95% confidence interval for the difference in population mean cholesterol levels. Give and interpretation of this interval. y1 y 2 t * s12 s22 n1 n2 t * 2.086 72.275 2.08611.9345 72.275 24.895 47.38 to 97.17 We are 95% confident that the population mean cholesterol for people who have had a heart attack is from 47.38 to 97.17 points higher than that for people who have not had a heart attack. 2 g) Do the results of the hypothesis test in e) and those of the confidence interval in f) agree? Explain briefly. Yes. The test of hypothesis indicated that the population mean cholesterol level of people who have had a heart attack is higher than that of people who have not had a heart attack. The confidence interval confirms this and says that the population mean cholesterol level of people who have had a heart attack can be from 47.4 to 97.2 points higher than that of people who have not had a heart attack. 2. An article in the Journal of the American Medical Association examined whether the true body temperature is 98.6 degrees Fahrenheit and if there are differences between men and women in terms of body temperature. JMP was used to analyze the data on separate random samples of 65 men and 65 women. The output is on the next page. a) Give the sample means and sample standard deviations for the two groups, men (M) and women (F). Sample Mean Sample Std Dev Women (F) 98.394 oF 0.7435 oF Men (M) 98.105 oF 0.6988 oF b) Compare the two samples in terms of center and spread. Women, on average have a slightly higher body temperature than men. Women also have slightly more variability in their body temperatures compared to men. c) Report the values of the 95% confidence interval for the difference between the population mean body temperatures for men and women. According to this interval could the difference in population mean body temperatures be zero? Explain briefly. Upper CL Dif = 0.53965 Lower CL Dif = 0.03881 We are 95% confident that the population mean body temperature for women is from 0.039 oF to 0.540 oF higher than the population mean body temperature for men. d) Test the hypothesis that the difference in population mean body temperatures is zero against and alternative that the difference is not zero. Be sure to include all the steps for a test of hypothesis. Step 1: Conditions There is a random sample of 65 women and a separate random sample of 65 men. The shapes of the data distributions for both women and men are symmetric and mounded in the middle. This supports the normal distribution condition. Step 2: Hypotheses H0 : F M H A : F M 3 Step 3: Test statistic and P-value t Ratio = 2.28543 P-value = Prob > |t| = 0.0239 Step 4: Decision Reject the null hypothesis because the P-value is small (< 0.05) Step 5: Conclusion The population mean body temperature for women is different from the population mean body temperature for men. e) Are the results of the test of hypothesis consistent with those for the confidence interval in c)? Explain briefly. Yes. The test indicates that there is a difference between the population mean body temperatures for men and women and the confidence interval says that that difference could be from from 0.039 oF to 0.540 oF. 4 Women (F) Men (M) Body Temperature oF 100.0% 75.0% 50.0% 25.0% 0.0% Women (F) maximum 100.8 quartile 98.8 median 98.4 quartile 98 minimum 96.4 Mean 98.393846 Std Dev 0.7434878 N 65 Body Temperature oF 100.0% 75.0% 50.0% 25.0% 0.0% Men (M) maximum quartile median quartile minimum Mean Std Dev N Difference Std Err Dif Upper CL Dif Lower CL Dif Confidence 99.5 98.6 98.1 97.6 96.3 98.104615 0.6987558 65 0.28923 0.12655 0.53965 0.03881 0.95 t Ratio DF Prob > |t| Prob > t Prob < t 2.28543 127.5103 0.0239* 0.0120* 0.9880 5
