Stat 101 – Exam 1 Name: ________________________ September
advertisement

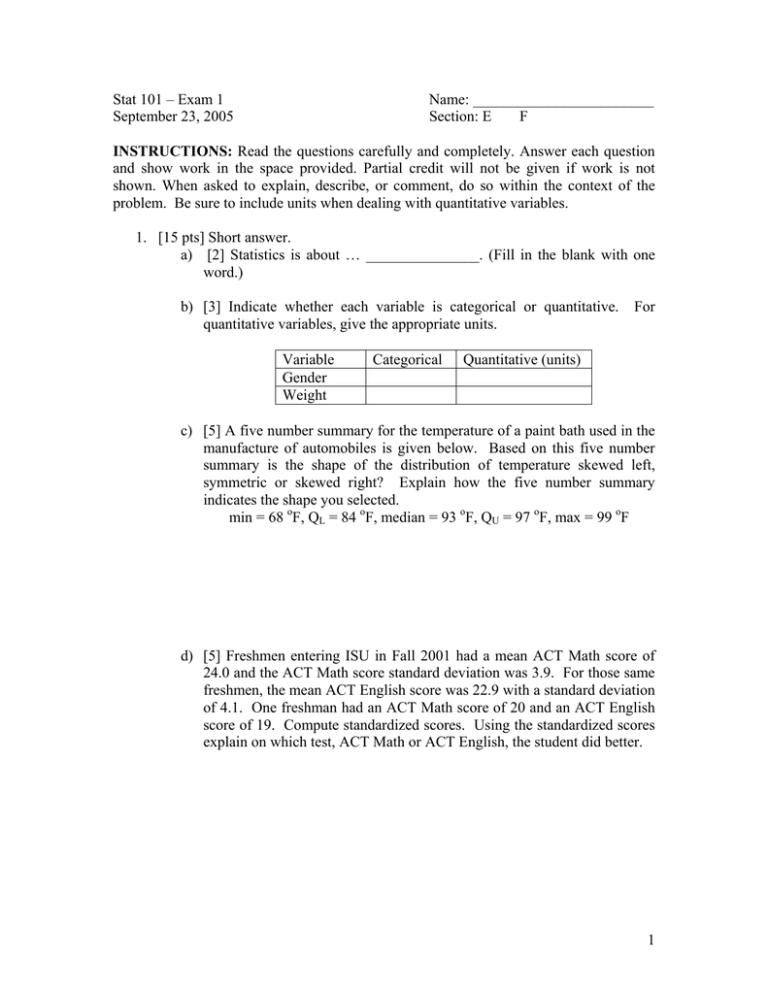
Stat 101 – Exam 1 September 23, 2005 Name: ________________________ Section: E F INSTRUCTIONS: Read the questions carefully and completely. Answer each question and show work in the space provided. Partial credit will not be given if work is not shown. When asked to explain, describe, or comment, do so within the context of the problem. Be sure to include units when dealing with quantitative variables. 1. [15 pts] Short answer. a) [2] Statistics is about … _______________. (Fill in the blank with one word.) b) [3] Indicate whether each variable is categorical or quantitative. quantitative variables, give the appropriate units. Variable Gender Weight Categorical For Quantitative (units) c) [5] A five number summary for the temperature of a paint bath used in the manufacture of automobiles is given below. Based on this five number summary is the shape of the distribution of temperature skewed left, symmetric or skewed right? Explain how the five number summary indicates the shape you selected. min = 68 oF, QL = 84 oF, median = 93 oF, QU = 97 oF, max = 99 oF d) [5] Freshmen entering ISU in Fall 2001 had a mean ACT Math score of 24.0 and the ACT Math score standard deviation was 3.9. For those same freshmen, the mean ACT English score was 22.9 with a standard deviation of 4.1. One freshman had an ACT Math score of 20 and an ACT English score of 19. Compute standardized scores. Using the standardized scores explain on which test, ACT Math or ACT English, the student did better. 1 2. [10 pts] The General Social Survey of people living in the United States includes two questions; “Taken all together, would you say that you are very happy, pretty happy, or not too happy?” and “Compared with American families in general, would you say that your family income is below average, average, or above average?” Below is a cross categorization of the answers by 852 survey participants in 2002. Income Above Average Average Below Average Total Not Too Happy 17 45 31 93 Happiness Pretty Happy 90 265 139 494 Very Happy Total 51 143 71 265 158 453 241 852 a) [2] Answer the questions Who? and What? for this situation. b) [2] What is the proportion of survey participants who are very happy? c) [2] Considering only participants with Above Average income, what is the proportion of above average income participants who are very happy? d) [4] Below is a Mosaic plot of Happiness versus Income. Based on this plot, does Income seem to be related to Happiness? Explain your answer briefly. 1.00 Very Happy Happiness 0.75 0.50 Pretty Happy 0.25 Not Too Happy 0.00 Above Average Average Below Average Income 2 3. [15 pts] An individual who wants to stay healthy buys a pedometer and records the miles walked every day. Below is partial JMP output for the analysis of miles walked on 25 randomly selected days. 10 6 2 0 1 2 3 4 5 6 7 8 Count 14 100.0% 75.0% 50.0% 25.0% 0.0% maximum quartile median quartile minimum Mean Std Dev N 7.500 3.775 3.200 2.600 1.400 3.336 1.1822 25 Distance walked (miles) a) [3] Answer the questions Who? and What? for this situation. b) [2] Give the value of the sample median. c) [3] Compute the value of the sample interquartile range. d) [1] There appears to be a potential outlier. What is the value for this potential outlier? e) [4] If the potential outlier is removed, what is the mean of the remaining 24 values? f) [2] The potential outlier is a value that is recorded incorrectly and should actually be 2 miles less than what is given. If this value is corrected, describe the shape of the distribution. 3 4. [15 pts] One hundred middle-aged men and one hundred young adult men were rated on physical flexibility. The scale went from 1, least flexible, to 10, most flexible. The table below shows a summary of these ratings. For example, only 1 Young Adult Man had a flexibility rating of 1 while 2 Middle-Aged Men received this rating. Young MiddlePhysical Adult Men Aged Men Flexibility Rating 1 1 2 2 3 6 3 6 10 4 8 14 5 11 17 6 14 18 7 16 14 8 19 11 9 14 6 10 8 2 a) [5] On the next page are two histograms. Label the axes on each of the histograms and indicate which histogram corresponds to Young Adult Men and which corresponds to Middle-Aged Men. b) [2] Describe the shape of the distribution of flexibility ratings for Young Adult Men. c) [3] What is the median flexibility rating for Young Adult Men? d) [2] Based on the shape of the distribution will the mean flexibility rating for Young Adult Men tend to be smaller than, about equal to, or larger than the median flexibility rating for Young Adult Men? Explain your answer briefly. Note: do not try to compute the mean flexibility rating to answer this question. e) [3] According to these data, who tend to be more physically flexible, Young Adult Men or Middle-Aged Men? Explain briefly. 4 20 15 10 5 0 1 2 3 4 5 6 7 8 9 10 1 2 3 4 5 6 7 8 9 10 20 15 10 5 0 5. [10 pts] Cumulative gpa for seniors at a large Midwestern university are described using a normal model with mean µ=2.93 and standard deviation σ=0.35. a) [2] Use the 68-95-99.7 rule to indicate the values that include the central 68% of the senior gpa’s. b) [4] A senior has a gpa of 3.42. What percentage of seniors have lower gpa’s? 5 c) [4] The university wishes to honor those seniors with gpa’s in the top 2% of their class. What gpa would a senior have to have in order to be honored? 3 .99 .95 .90 .75 .50 .25 .10 .05 .01 2 1 0 Normal Quantile Plot 6. [5 pts] Amounts of certain elements in the blood can give doctors an indication of potential problems and help in diagnosing various health disorders. One such element is potassium. Below is the JMP output for the amount of potassium (millimoles per liter, mmol/L) for a sample of 40 adult women. Could this sample have come from a population that follows a normal model? Be sure to support your answer by referring to all three plots. -1 -2 -3 12 8 6 Count 10 4 2 2.5 3.0 3.5 4.0 4.5 5.0 5.5 6.0 Potassium (mmol/L) 6


