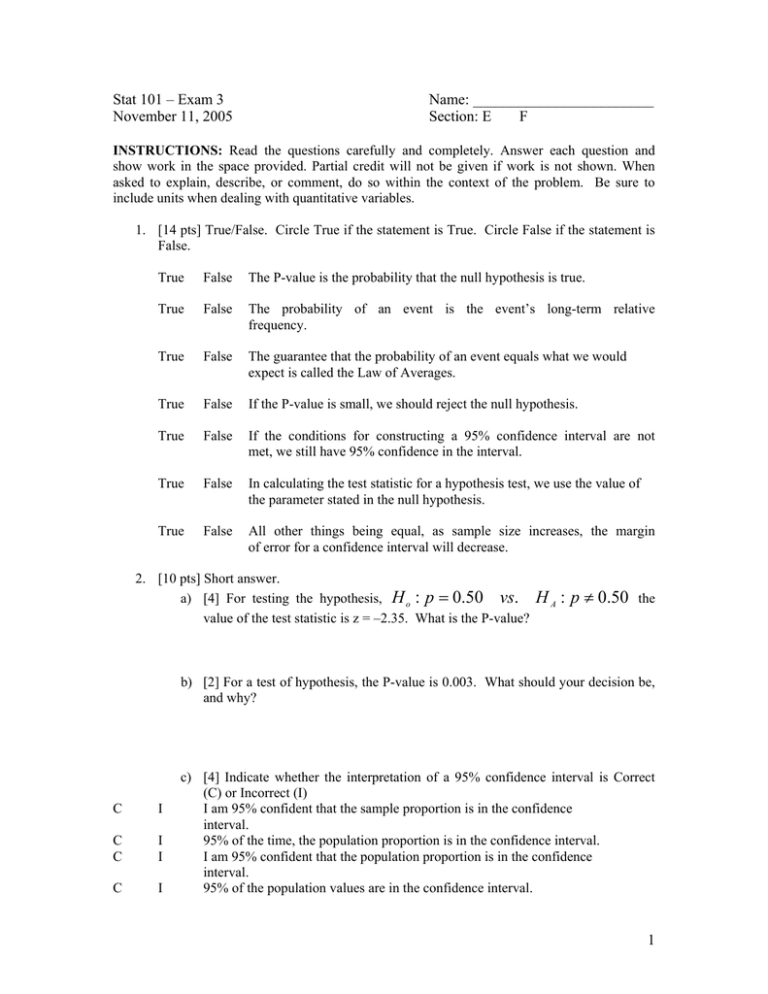
Stat 101 – Exam 3 Name: ________________________ November
advertisement

Stat 101 – Exam 3 November 11, 2005 Name: ________________________ Section: E F INSTRUCTIONS: Read the questions carefully and completely. Answer each question and show work in the space provided. Partial credit will not be given if work is not shown. When asked to explain, describe, or comment, do so within the context of the problem. Be sure to include units when dealing with quantitative variables. 1. [14 pts] True/False. Circle True if the statement is True. Circle False if the statement is False. True False The P-value is the probability that the null hypothesis is true. True False The probability of an event is the event’s long-term relative frequency. True False The guarantee that the probability of an event equals what we would expect is called the Law of Averages. True False If the P-value is small, we should reject the null hypothesis. True False If the conditions for constructing a 95% confidence interval are not met, we still have 95% confidence in the interval. True False In calculating the test statistic for a hypothesis test, we use the value of the parameter stated in the null hypothesis. True False All other things being equal, as sample size increases, the margin of error for a confidence interval will decrease. 2. [10 pts] Short answer. a) [4] For testing the hypothesis, H o : p = 0.50 vs. value of the test statistic is z = –2.35. What is the P-value? H A : p ≠ 0.50 the b) [2] For a test of hypothesis, the P-value is 0.003. What should your decision be, and why? C I C C I I C I c) [4] Indicate whether the interpretation of a 95% confidence interval is Correct (C) or Incorrect (I) I am 95% confident that the sample proportion is in the confidence interval. 95% of the time, the population proportion is in the confidence interval. I am 95% confident that the population proportion is in the confidence interval. 95% of the population values are in the confidence interval. 1 3. [14 pts] Consider the population of all ISU Stat 101 students who have responded to the beginning of the semester survey. There are over 1,400 students in this population. For this population, the proportion of students whose hometown is less than 50 miles from Ames is 0.24. a) [4] For random samples of 50 students taken from this population, describe the sampling distribution of p̂ , the sample proportion of students whose hometown is less than 50 miles from Ames. Be sure to include shape, center and spread. b) [2] Is the 10% condition satisfied? Explain briefly. c) [3] Is the success/failure condition satisfied? Explain briefly. d) [5] What is the probability that a random sample of 50 students taken from this population will have 20 or more students whose hometown is less than 50 miles from Ames? 2 4. [16 pts] An article in the Des Moines Register on Sunday, October 23, 2005 reported on a survey of 1,001 randomly selected adults in the U.S. that was taken August 22-24, 2005. In the survey, the adults were asked; “Compared to 20 or 30 years ago do you think people are more rude, less rude or about the same.” 69% of the survey respondents answered “more rude.” a) [2] What is the population? b) [2] What is the sample? c) [5] Are the conditions for constructing a confidence interval for the population proportion satisfied? Support your answer. d) [5] Construct a 98% confidence interval on the population proportion of all adults who would answer the question “more rude.” e) [2] Will a 90% confidence interval be wider of narrower than the one you constructed in d)? You do not need to construct a new interval to answer this question. 3 5. [16 pts] A manufacturer is concerned because during the final inspection of items it currently rejects, and therefore cannot sell, 12% of its product. A new process is introduced that hopefully will reduce the proportion of rejected items. After the new process has been in place for a while, a random sample of 100 parts is selected and inspected. Of those 100 items 8 are rejected. We want to know if the new process has been effective in reducing the proportion of rejected parts? a) [3] Set up the appropriate null and alternative hypotheses. Be sure to clearly define what the population proportion is. b) [3] Are the conditions for statistical inference met? Explain briefly. c) [4] Compute the value of the test statistic and the associated P-value. d) [2] Use the P-value to make a decision. e) [4] State your conclusion within the context of the problem. 4 Formulas Sampling Distribution of p̂ : Mean: p Standard Deviation: SD( pˆ ) = p (1 − p ) n pˆ − p p (1 − p ) n z= Confidence interval for p: pˆ − z * pˆ (1 − pˆ ) pˆ (1 − pˆ ) to pˆ + z * n n Confidence z* 80% 1.282 90% 1.645 95% 2 or 1.96 98% 2.326 99% 2.576 Sample Size: 2 ( 1 z * ) p(1 − p ) n≤ or n = (M.E.)2 (M.E.)2 Test Statistic: H o : p = po z= pˆ − po po (1 − po ) n H A : p < po P − value = Pr < z H A : p > po P − value = Pr > z H A : p ≠ po P − value = 2(Pr > z ) Table Z is on the last page. 5


