Manufacturing Environment Reliability: The Other Dimension of Quality Today’s manufacturers face:
advertisement
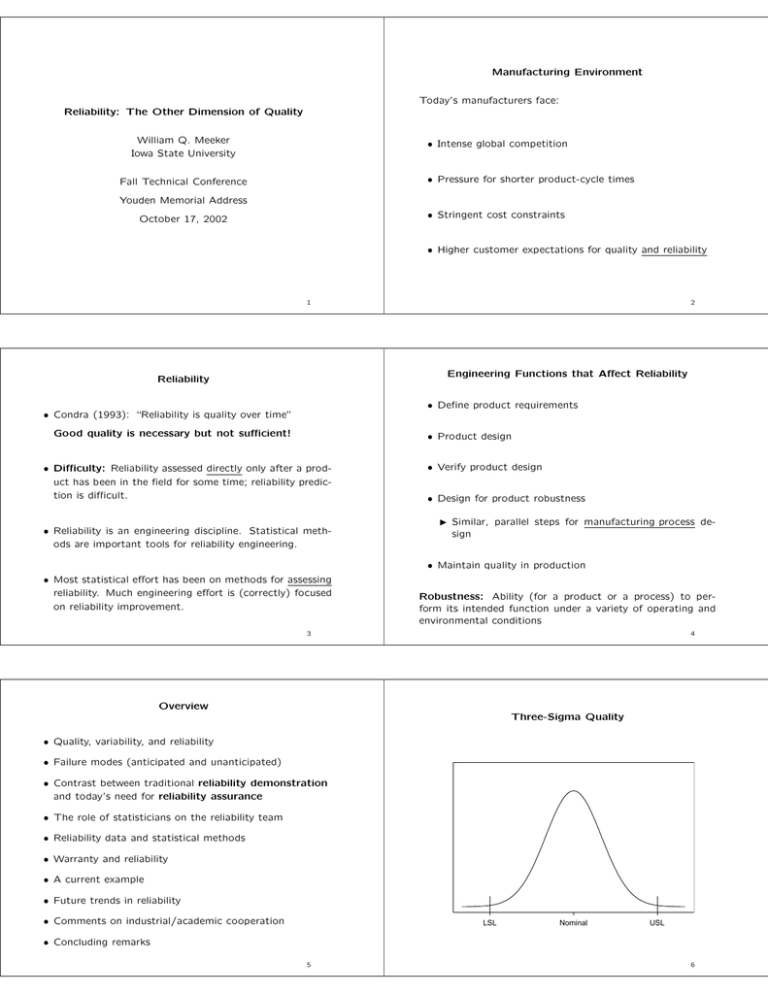
Manufacturing Environment Today’s manufacturers face: Reliability: The Other Dimension of Quality William Q. Meeker Iowa State University • Intense global competition • Pressure for shorter product-cycle times Fall Technical Conference Youden Memorial Address • Stringent cost constraints October 17, 2002 • Higher customer expectations for quality and reliability 1 2 Engineering Functions that Affect Reliability Reliability • Define product requirements • Condra (1993): “Reliability is quality over time” Good quality is necessary but not sufficient! • Product design • Difficulty: Reliability assessed directly only after a product has been in the field for some time; reliability prediction is difficult. • Reliability is an engineering discipline. Statistical methods are important tools for reliability engineering. • Verify product design • Design for product robustness Similar, parallel steps for manufacturing process design • Maintain quality in production • Most statistical effort has been on methods for assessing reliability. Much engineering effort is (correctly) focused on reliability improvement. Robustness: Ability (for a product or a process) to perform its intended function under a variety of operating and environmental conditions 3 4 Overview Three-Sigma Quality • Quality, variability, and reliability • Failure modes (anticipated and unanticipated) • Contrast between traditional reliability demonstration and today’s need for reliability assurance • The role of statisticians on the reliability team • Reliability data and statistical methods • Warranty and reliability • A current example • Future trends in reliability • Comments on industrial/academic cooperation LSL Nominal USL • Concluding remarks 5 6 Drifting Three-Sigma Quality (Effect on Reliability) Good and Bad Quality <---- Good Quality <---- Poor Quality LSL LSL Nominal Nominal USL USL 7 8 Six-Sigma Quality (Target: 3.4 Defects per Million Opportunities) Sources of Variability (Noise) Affecting Product Reliability • Manufacturing (including raw materials) • Environmental conditions • Customer use rates • Wear/degradation LSL Nominal USL 9 10 Unanticipated Failure Modes Anticipated Failure Modes Goal: To discover and eliminate failure modes as early as possible • Information on component reliability • FMEA analysis in up-front design Handbook values Previous experience Physical models (e.g. FEM) with some empirical model verification. • Robust design ideas (make product robust to external noises) • HALT testing Test data and accelerated test data • Early feedback from the field • System reliability model Downstream discoveries are more expensive! 11 12 Reliability Assurance Based on Reliability Modeling and Combining Information Reliability Demonstration versus Reliability Assurance Inputs: • Example: Using minimal assumptions, to demonstrate that reliability at time t0 hours is .99, with 95% confidence, requires testing at least 230 units for t0 hours with zero failures. To have a 80% chance of passing the test, requires that the true reliability be approximately .999 • Engineering knowledge • For complicated, expensive systems, traditional reliability demonstration is usually not practicable • Physical experimentation • Physical models • Previous experience (e.g., field data) • Factors of safety • Reliability assurance is the alternative Challenge: Quantify uncertainty Approach: Responsible use of Bayesian methods (e.g. LANL PREDICT) 13 14 The Role of Statisticians on the Reliability Team Structured Programs for Design for Reliability Design for Reliability implies the use of product and process design to eliminate problems before they occur • Design for Six Sigma (DFSS developed at GE) has the DMADV steps: Define, Measure, Analyze, Design, Verify • Other company-specific reliability improvement programs. Contrast with the traditional Build,Test,Fix,Test,Fix,... approach that uses “reliability growth modeling.” • Contribute to the understanding and modeling of variation • Help fill in the gaps in engineering knowledge by designing experiments and interpreting results • Use appropriate statistical method to make the most effective use of field and warranty data • Develop appropriate methods for combining information • Develop methods for quantifying uncertainty (statistical and model) • Develop methods (especially graphical methods) for the effective presentation of results. 15 16 Failure Pattern in the Bearing Cage Data Distinguishing Features of Reliability Data • Data are typically censored (bounds on observations). Count • Models for positive random variables (e.g., exponential, lognormal, Weibull, gamma). Normal distribution not common. • Model parameters not of primary interest (instead, failure rates, quantiles, probabilities). • Extrapolation often required (e.g., have one year of data, but want proportion failing after three years). Row 1 2 3 4 5 6 7 8 9 10 11 12 13 14 15 16 17 18 19 20 21 22 23 24 25 288 148 124 111 106 99 110 114 119 127 123 93 47 41 27 11 6 2 0 500 1000 1500 2000 Hours of Operation 17 18 Weibull Probability Plot for Bearing Cage Data Lognormal Probability Plot for Bearing Cage Data .2 .6 Lognormal Distribution ML Fit Weibull Distribution ML Fit Lognormal Distribution 95% Pointwise Confidence Intervals .5 .1 .4 .3 .05 Proportion Failing Proportion Failing .2 • .03 .02 .01 • • .005 .003 • 100 .01 .002 • .001 .0005 • .0003 • .02 • • .005 • .001 .0005 .1 .05 • • .0001 .00005 200 500 1000 2000 5000 10000 200 500 Hours 1000 2000 5000 10000 Hours 19 20 Device-B Power Drop Accelerated Degradation Test Results at 150◦C, 195◦C, and 237◦C (Use conditions 80◦C) • • • ••• •• ••• • • ••• • •• • • •• • ••• •• • •• • 0.0 5 Power drop in dB 10 -0.2 -0.4 -0.6 • •• • • -0.8 • • -1.0 -1.2 0 Percent Increase in Operating Current 15 Percent Increase in Operating Current for GaAs Lasers Tested at 80◦C (Use conditions 10◦C) -1.4 0 1000 2000 3000 4000 0 •• • • •• • • • •• •• • • •• •• ••• •• • • •• • •• • • • •• •• • •• • • • • • • • •• •• • • • •• •• ••• •• • • • • • • ••• • • •• • • • 150 Degrees C • •• • •• • • •• •• •• ••• • •• •• •• •• • • • • • • • • • • • • • •• • • • • • • • • •• • • • • • • • • • • • • •• •• • • • • • • • • • • • • • • • •• •• • • • • • ••• •• •• • • • • • • • •• • • • • • • • • • • • • • • • •• • • •• •• • • •• • • • • • • • •• •• • •• •• •• •• •• • ••• • • • •• • •• •• • • •• • • • • • • • •• • • • • • • • • • • • • • • • • • • • • 195 Degrees C • • • •• • • • • • • • • • • • • • • •• •• •• • • • • • • • • • • • •• • • 237 Degrees C • • • • •• 1000 Hours 2000 •• • • • • •• • • • •• ••• • 3000 • • • • • • • • • •• • • • • 4000 Hours 21 22 Maintenance Events for a Fleet of Earth-Moving Machines Adhesive Bond Accelerated Degradation Test AdhesiveBondB data Destructive Degradation Regression Analyses Resp:Log,Time:Square root,x:Arrhenius, Dist:Smallest Extreme Value 10 8 Machine Number Pounds 6 5 4 3 2 50DegreesC 60DegreesC 70DegreesC 25 DegreesC 1 0 20 40 60 80 1 2 3 4 5 6 7 8 9 10 11 12 13 14 15 16 17 18 19 20 21 22 23 120 0 Days 2000 4000 6000 8000 Hours of Operation 23 24 Warranty and Reliability Mean Cumulative Number of Labor Hours Mean Cumulative Cost for a Fleet of Earth-Moving Machines • Warranties are more related to marketing than reliability! • In many industries, warranty costs are substantial. 140 120 • Warranty data are messy 100 • Useful information in warranty data for: 80 60 Financial reporting 40 Feedback for the next product generation 20 Early warning of unanticipated problems 0 0 2000 4000 6000 8000 Connection with laboratory testing and environmental characterization. Age in Hours of Operation 25 26 NIST Cooperative Research and Development Agreement (CRADA) Current Example Service Life of Organic Paints and Coatings • Goal: Develop useful accelerated testing methods to allow the rapid screening and assessment of service life of potential new products. • Previous efforts in this industry have not been satisfactory • Useful discussions at two international conferences on the subject • Multi-year project at National Institute of Standards and Technology, Materials and Construction Research Division, Building and Fire Research Laboratory (Jon Martin, Project Leader) • Approach: Use careful experimentation and physical/chemical theory to understand degradation mechanisms and to build (and verify) the necessary predictive models. • Focus on an important industrial problem. 27 Scientific Plan 28 Trends in the Use of Statistics in Reliability • Careful laboratory experiments controlling UV radiation intensity and spectrum, temperature, and humidity. • Experimental setup based on the NIST SPHERE (Simulated Photodegradation by High Energy Radiant Exposure) • More use of degradation data and models • Increased use of statistical methods for producing robust product and process designs • More use of computer models to reduce reliance on expensive physical experimentation • Outdoor experimental sites in four different climates, with monitoring of UV radiation intensity and spectrum, temperature, and humidity. • Better understanding of the product environment (e.g. through the use of “smart chips”). • Environmental realization, when used to drive the physical/chemical model, should produce results similar to outdoor exposure. • More efforts to combine data from different sources and other information (through the use of “Responsible Bayes” methods). 29 30 Accelerated Test Results Using Standard Censored Data Regression Accelerated Test Results Using Standard Censored Data Regression Assuming That Arrhenius Activation Energy is Known .95 .95 .9 .9 .8 .8 .7 .6 .5 .4 .3 Proportion Failing Proportion Failing .7 .2 .1 .05 .02 .6 .5 .4 .3 .2 .1 .05 .02 .01 .005 .01 .005 .002 .002 .0005 .0005 300 Deg C .0001 250 200 175 150 100 300 Deg C .0001 10 2 3 10 10 4 10 5 10 6 10 250 200 175 150 100 7 10 2 Hours 3 10 10 4 10 5 10 6 10 7 Hours 31 Academic Involvement in Manufacturing Reliability Problems 32 Facilitating Academic Involvement in Manufacturing Reliability Problems • Manufacturing industries have interesting, challenging, technical problems in reliability. • Student internships with opportunities for faculty visits (LANL model). • There should be more academic involvement in these projects • NSF GOALI (Grant Opportunities for Academic Liaison with Industry) program • Benefits: • Work for free The quality of academic research will improve with access to real problems High probability of impact Cost-effective for industry • Needs: Academics willing to get their hands dirty (and learn the language and science used in real problems) Industrial sponsors willing to invest the time needed to lead and conduct the project. Better industry/academic relationships 33 Concluding Remarks • SPC and designed experiments have been useful for improving quality and reliability • Statisticians have an important supporting role to play in the reliability area • Further improvements in reliability possible by focusing on causes of failure • Upstream reliability testing/analysis has important advantages • Use downstream information (e.g. Warranty data) on current and previous product to make upstream improvements in future product • Problem: Importantly large savings may be difficult to quantify to management. 35 34
