Document 10785003
advertisement
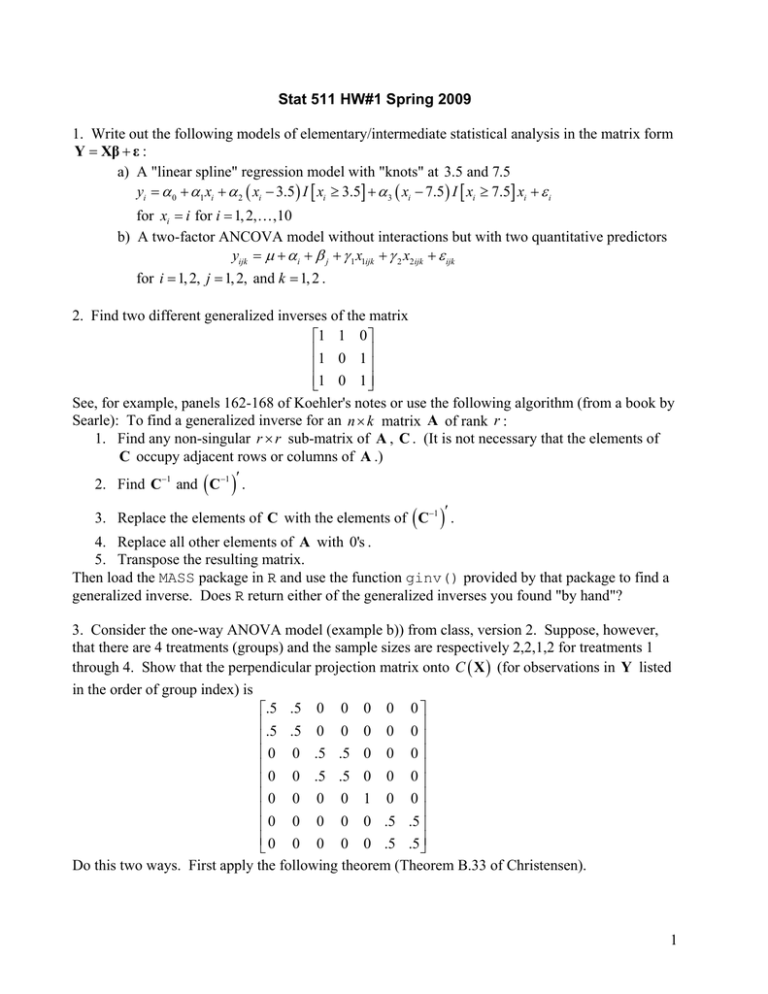
Stat 511 HW#1 Spring 2009 1. Write out the following models of elementary/intermediate statistical analysis in the matrix form Y = Xβ + ε : a) A "linear spline" regression model with "knots" at 3.5 and 7.5 yi = α 0 + α1 xi + α 2 ( xi − 3.5 ) I [ xi ≥ 3.5] + α 3 ( xi − 7.5 ) I [ xi ≥ 7.5] xi + ε i for xi = i for i = 1, 2,… ,10 b) A two-factor ANCOVA model without interactions but with two quantitative predictors yijk = μ + α i + β j + γ 1 x1ijk + γ 2 x2ijk + ε ijk for i = 1, 2, j = 1, 2, and k = 1, 2 . 2. Find two different generalized inverses of the matrix ⎡1 1 0 ⎤ ⎢1 0 1 ⎥ ⎢ ⎥ ⎢⎣1 0 1 ⎥⎦ See, for example, panels 162-168 of Koehler's notes or use the following algorithm (from a book by Searle): To find a generalized inverse for an n × k matrix A of rank r : 1. Find any non-singular r × r sub-matrix of A , C . (It is not necessary that the elements of C occupy adjacent rows or columns of A .) 2. Find C−1 and C−1 ′ . ( ) 3. Replace the elements of C with the elements of ( C−1 )′ . 4. Replace all other elements of A with 0's . 5. Transpose the resulting matrix. Then load the MASS package in R and use the function ginv() provided by that package to find a generalized inverse. Does R return either of the generalized inverses you found "by hand"? 3. Consider the one-way ANOVA model (example b)) from class, version 2. Suppose, however, that there are 4 treatments (groups) and the sample sizes are respectively 2,2,1,2 for treatments 1 through 4. Show that the perpendicular projection matrix onto C ( X ) (for observations in Y listed in the order of group index) is ⎡.5 .5 0 0 0 0 0 ⎤ ⎢.5 .5 0 0 0 0 0 ⎥ ⎢ ⎥ ⎢ 0 0 .5 .5 0 0 0 ⎥ ⎢ ⎥ ⎢ 0 0 .5 .5 0 0 0 ⎥ ⎢0 0 0 0 1 0 0⎥ ⎢ ⎥ ⎢ 0 0 0 0 0 .5 .5⎥ ⎢ 0 0 0 0 0 .5 .5⎥ ⎣ ⎦ Do this two ways. First apply the following theorem (Theorem B.33 of Christensen). 1 Theorem B.33 M is a perpendicular projection matrix onto C ( M ) if and only if MM = M and M′ = M . (You'll need to reason that every column of X can be written as a linear combination of columns of M and vice versa, so that C ( X ) = C ( M ) .) Then secondly, use the construction for PX (involving a generalized inverse) given in class. 4. In the context of Problem 3, Suppose that Y′ = ( 3,1, 4, 6,3,5, 4 ) . a) Find Ŷ , the least squares estimate of E Y = Xβ . Show that there is no sensible way to identify an "ordinary least squares estimate of β " by finding two different vectors b ˆ. with Xb = Y ( ) ( )( ) ˆ ,Y − Y ˆ ,Y ˆ′ Y−Y ˆ , Y′Y, Y ˆ ′Y ˆ , and Y − Y ˆ ′ Y−Y ˆ . b) Use R and compute all of Y 5. Stat 542 and Stat 447 are supposed to cover multivariate distributions, and in particular multivariate normal distributions. Chapters 3 and 4 of Rencher cover that material and there are some summary facts in Appendix 7.1 of the 2008 Stat 511 Course Outline on this material. Review those if you need to do so. Then answer the following (making use of R to do matrix calculations). Suppose that Y ∼ MVN 3 ( μ, Σ ) with μ′ = (1,3, 0 ) and ⎛4 2 1⎞ ⎜ ⎟ Σ = ⎜ 2 4 2⎟ ⎜1 2 4⎟ ⎝ ⎠ a) What is the marginal distribution of y3 ? b) c) d) e) f) g) What is the (marginal joint) distribution of y1 and y3 ? What is the conditional distribution of y3 given that y1 = 2 ? What is the conditional distribution of y3 given that y1 = 2 and y2 = −1 ? What is the conditional distribution of y1 and y3 , given that y2 = −1 ? What are the correlations ρ12 , ρ13 , and ρ 23 ? What is the joint distribution of u = y1 − 2 y2 − y3 and v = y1 − y2 + 3 ? 6. Use the eigen() function in R to compute the eigenvalues and eigenvectors of the matrix Σ in problem 5. Then use R to find an "inverse square root" of this matrix. That is, find a symmetric matrix W such WW = V −1 . See slides 87-89 and 91of Koehler's notes or Rencher and Schaalje page 53 for help with this. 7. (Koehler) Consider the matrices 4.001⎤ 4.001 ⎤ ⎡ 4 ⎡ 4 A=⎢ and B = ⎢ ⎥ ⎥ ⎣ 4.001 4.002 ⎦ ⎣ 4.001 4.002001⎦ 2 Obviously, these matrices are nearly identical. Use R and compute the determinants and inverses of these matrices. (Note that A −1 ≈ −3B −1 even though the original two matrices are nearly the same. This shows that small changes in the in the elements of nearly singular matrices can have big effects on some matrix operations.) 8. c′β is estimable exactly when c ∈ C ( X′ ) . This occurs exactly when c = PX′c , that is when c is its own projection onto C ( X′ ) . Clearly, PX′ = X′ ( XX′ ) X . Use R and find this matrix for the − situation of Problem 3. Then use this matrix and R to decide which of the following linear combinations of parameters are estimable in this example: 1 1 τ 2 ,τ 1 − τ 3 , μ + (τ 1 + τ 2 + τ 3 ) , μ + τ 1 + τ 2 − τ 3 ,τ 1 − (τ 2 + τ 3 ) , and (τ 1 − τ 2 ) − (τ 3 − τ 4 ) 3 2 − For those that are estimable, find the 7 × 1 row vector c′ ( X′X ) X′ that when multiplied by Y produces the ordinary least squares estimate of c′β . 9. Twice now you've been asked to compute projection matrices in R. It seems like it would be helpful to "automate" this. Have a look at Chapter 10 of An Introduction to R (see HelpÆManuals(in PDF) after starting R). Write a function (call it, say, project) that for an input matrix produces a matrix that projects vectors onto the column space of the input matrix. Test your function by running it on both X and X′ for the situation of Problem 3. 10. Consider the (non-full-rank) "effects model" for the 2 × 2 factorial (with 2 observations per cell) called example d in lecture. a) Determine which of the parametric functions below are estimable. α1 , αβ11 , α1 − α 2 , β1 − β 2 + αβ11 − αβ12 , μ + α1 + β1 + αβ11 , αβ12 − αβ11 − (αβ 22 − αβ 21 ) For those that are estimable, find the 8 ×1 row vector c′ ( X′X ) X′ that when multiplied by Y produces the ordinary least squares estimate of c′β . b) For the parameter vector β written in the order used in class, consider the hypothesis H 0 : Cβ = 0 , for − ⎛ 0 1 −1 0 0 0 0 0 0 ⎞ C=⎜ ⎟ ⎝ 0 0 0 1 −1 0 0 0 0 ⎠ Is this hypothesis "testable"? Explain. 11. Consider part b) of Problem 1. Write the hypothesis that the first three responses all have the same mean in the form H 0 : Cβ = d . 3
