Statistics 496, Applied Statistics for Industry II Name: Exam 1, Spring 1997 Site:
advertisement

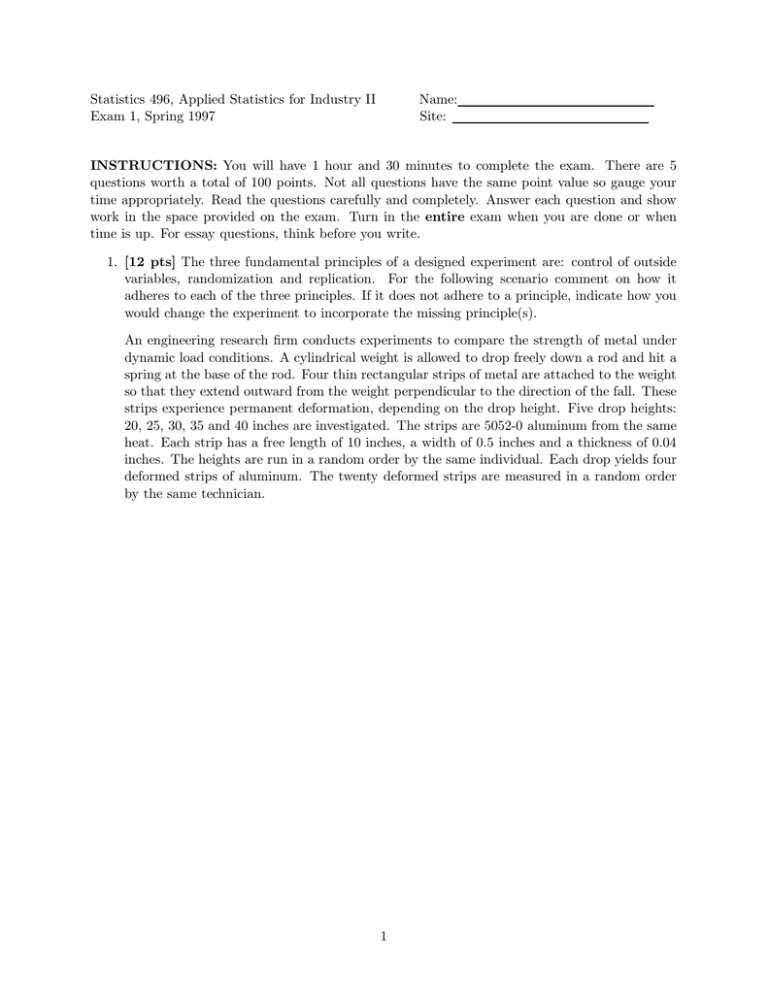
Statistics 496, Applied Statistics for Industry II Exam 1, Spring 1997 Name: Site: INSTRUCTIONS: You will have 1 hour and 30 minutes to complete the exam. There are 5 questions worth a total of 100 points. Not all questions have the same point value so gauge your time appropriately. Read the questions carefully and completely. Answer each question and show work in the space provided on the exam. Turn in the entire exam when you are done or when time is up. For essay questions, think before you write. 1. [12 pts] The three fundamental principles of a designed experiment are: control of outside variables, randomization and replication. For the following scenario comment on how it adheres to each of the three principles. If it does not adhere to a principle, indicate how you would change the experiment to incorporate the missing principle(s). An engineering research firm conducts experiments to compare the strength of metal under dynamic load conditions. A cylindrical weight is allowed to drop freely down a rod and hit a spring at the base of the rod. Four thin rectangular strips of metal are attached to the weight so that they extend outward from the weight perpendicular to the direction of the fall. These strips experience permanent deformation, depending on the drop height. Five drop heights: 20, 25, 30, 35 and 40 inches are investigated. The strips are 5052-0 aluminum from the same heat. Each strip has a free length of 10 inches, a width of 0.5 inches and a thickness of 0.04 inches. The heights are run in a random order by the same individual. Each drop yields four deformed strips of aluminum. The twenty deformed strips are measured in a random order by the same technician. 1 2. [30 pts] An experiment is performed where the amount of catalyst, X is varied and the reaction time, Y is measured. Below are summary data for the experiment. Amount of Catalyst, Xi 0 1 2 3 4 Mean reaction time, Ȳi 79.3 61.5 47.9 41.0 32.8 Standard deviation of times, si 10.2 9.3 9.5 9.9 9.6 number of replicates, ni 5 5 5 5 5 Below is a graph of the reaction times versus amount of catalyst. (a) [4] Describe the general relationship between reaction time and amount of catalyst. 2 (b) [4] The experimenter uses Minitab to develop a linear equation relating reaction time, Yi to amount of catalyst, Xi . The equation she got was: Ŷi = 75.2 − 11.35Xi Use this equation to predict the reaction time when the amount of catalyst is 4 grams. How close is this prediction to the mean reaction time for 4 grams of catalyst? (c) [4] Use a coded variable to verify that this equation is correct. You must show your work to get full credit. (d) [4] The multiple regression of Y i on the coded linear predictor, C1i , and coded quadratic predictor, C2i is: Ŷi = 52.5 − 11.35C1i + 1.85C2i Use this prediction equation to predict a reaction time with 4 grams of catalyst. Is this a better/worse prediction than what you found in (b)? 3 (e) [4] What is M SrepError for this problem? (f) [5] Is there a significant linear relationship between the amount of catalyst and reaction time? Support your answer with an appropriate test statistic and interpretation. (g) [5] Is there a significant quadratic relationship between the amount of catalyst and reaction time? Support your answer with an appropriate test statistic and interpretation. 3. [20 pts] An important quality characteristic for lithographic printing presses is the viscosity of the ink. If viscosity is too high, the ink will not flow through the press fast enough, while a low viscosity will result in too much ink flowing through the press. The target viscosity is 300, with upper and lower specifications set at 110% and 90% of target, respectively. A viscosity measurement is taken at the end of production of each batch of ink. If viscosity is outside the specification limits the batch is scrapped. Management has stressed the importance of not scrapping batches. Viscosity measurements for 50 consecutive batches are summarized in the charts on the next page. 4 5 (a) [4] Using the operational definition of control as no points outside 3-‘sigma’ limits, describe the stability of the process. Make specific references to the control charts for viscosity. (b) [4] What is the estimated value of the process potential index, C p , using the overall standard deviation? What does this value indicate? (c) [4] What is the estimated value of the process capability index, C pk , using the overall standard deviation? What does this value indicate? (d) [4] Use R̄ to obtain an estimate of the process standard deviation. Is this very much different from the overall standard deviation, s? (e) [4] Describe the shape of the histogram given in the capability analysis output. Give an explanation for this shape. 6 4. [20 pts] An independent consumer research firm is planning a fuel economy study to compare 4 diesel-powered vehicles. The four are: Mercedes, Peugeot, Oldsmobile, and Volkswagon. All vehicles will be tested under controlled conditions in a laboratory using a dynamometer to control speed and load conditions. Fuel economy will be measured in terms of miles per gallon (mpg). (a) [4] If chances of error are set at α = 0.05 and β = 0.10, and a difference in mean mpg of 1 standard deviation is to be detected, how many replications are required? (b) [6] If resources limit the number of replications to 10 per vehicle, give two configurations of α, β and the size of the difference that will achieve this. Explain briefly what you are trading off between the two choices. (c) [6] An argument develops over what is replication. One person says its having several vehicles, thus to do the experiment the research firm must get 10 Mercedes, 10 Peugeots, 10 Oldsmobiles and 10 Volkswagons. The other person argues that this is a waste of money, that one vehicle is sufficient provided each is tested 10 times. Discuss the advantages and disadvantages of each person’s definition of “replication.” Be sure to comment on the scope of the experiment for each definition. (d) [4] Explain, explicitly, how you would use randomization in this experiment. 7 5. [18 pts] An experiment is conducted to compare the degree of soiling for cotton fabric copolymerized with three different mixtures of methacrylic acid. Lower values are desirable. Mixture 1 Mixture 2 Mixture 3 0.87 0.72 0.79 1.12 0.67 1.05 0.90 0.87 1.05 1.07 0.78 0.96 0.94 0.91 0.90 M SrepError = 0.01135 (a) [4] Calculate the mean degree of soiling for each mixture. (b) [4] Calculate the Least Significant Difference (LSD) (use t=2) for comparing the mean degree of soiling for the three mixtures. (c) [5] Which mixture(s) is (are) significantly different from the others? Use the LSD for (b). Which mixture would you recommend? (d) [5] If you use an LSD calculated using t=3, which mixture would you recommend? 8


