IMPACT - Prof. Alan C. Czarnetzki
advertisement
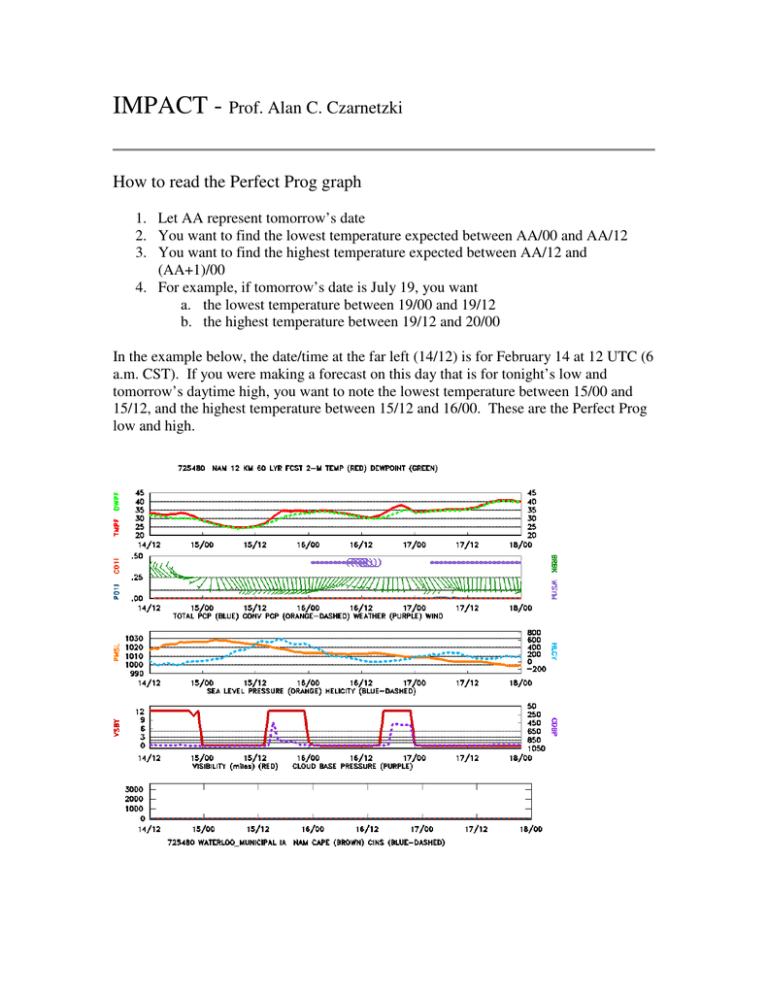
IMPACT - Prof. Alan C. Czarnetzki How to read the Perfect Prog graph 1. Let AA represent tomorrow’s date 2. You want to find the lowest temperature expected between AA/00 and AA/12 3. You want to find the highest temperature expected between AA/12 and (AA+1)/00 4. For example, if tomorrow’s date is July 19, you want a. the lowest temperature between 19/00 and 19/12 b. the highest temperature between 19/12 and 20/00 In the example below, the date/time at the far left (14/12) is for February 14 at 12 UTC (6 a.m. CST). If you were making a forecast on this day that is for tonight’s low and tomorrow’s daytime high, you want to note the lowest temperature between 15/00 and 15/12, and the highest temperature between 15/12 and 16/00. These are the Perfect Prog low and high.

