Document 10768667
advertisement
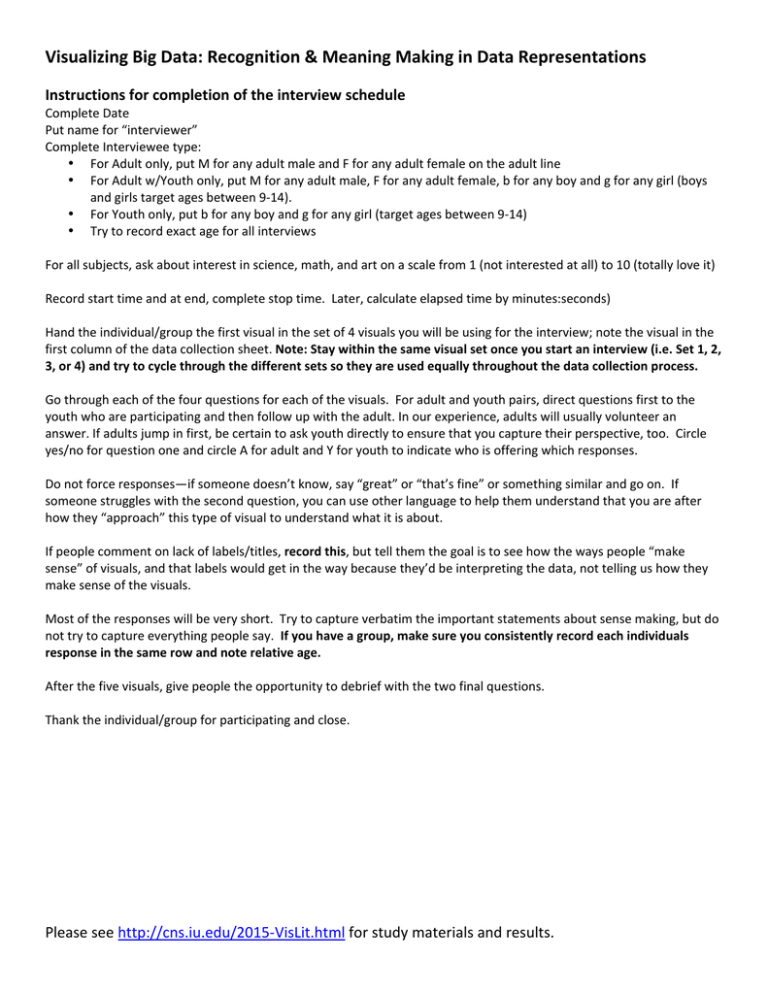
Visualizing Big Data: Recognition & Meaning Making in Data Representations Instructions for completion of the interview schedule Complete Date Put name for “interviewer” Complete Interviewee type: • For Adult only, put M for any adult male and F for any adult female on the adult line • For Adult w/Youth only, put M for any adult male, F for any adult female, b for any boy and g for any girl (boys and girls target ages between 9-­‐14). • For Youth only, put b for any boy and g for any girl (target ages between 9-­‐14) • Try to record exact age for all interviews For all subjects, ask about interest in science, math, and art on a scale from 1 (not interested at all) to 10 (totally love it) Record start time and at end, complete stop time. Later, calculate elapsed time by minutes:seconds) Hand the individual/group the first visual in the set of 4 visuals you will be using for the interview; note the visual in the first column of the data collection sheet. Note: Stay within the same visual set once you start an interview (i.e. Set 1, 2, 3, or 4) and try to cycle through the different sets so they are used equally throughout the data collection process. Go through each of the four questions for each of the visuals. For adult and youth pairs, direct questions first to the youth who are participating and then follow up with the adult. In our experience, adults will usually volunteer an answer. If adults jump in first, be certain to ask youth directly to ensure that you capture their perspective, too. Circle yes/no for question one and circle A for adult and Y for youth to indicate who is offering which responses. Do not force responses—if someone doesn’t know, say “great” or “that’s fine” or something similar and go on. If someone struggles with the second question, you can use other language to help them understand that you are after how they “approach” this type of visual to understand what it is about. If people comment on lack of labels/titles, record this, but tell them the goal is to see how the ways people “make sense” of visuals, and that labels would get in the way because they’d be interpreting the data, not telling us how they make sense of the visuals. Most of the responses will be very short. Try to capture verbatim the important statements about sense making, but do not try to capture everything people say. If you have a group, make sure you consistently record each individuals response in the same row and note relative age. After the five visuals, give people the opportunity to debrief with the two final questions. Thank the individual/group for participating and close. Please see http://cns.iu.edu/2015-­‐VisLit.html for study materials and results.
