Practice problems for final exam (STAT 574S)
advertisement

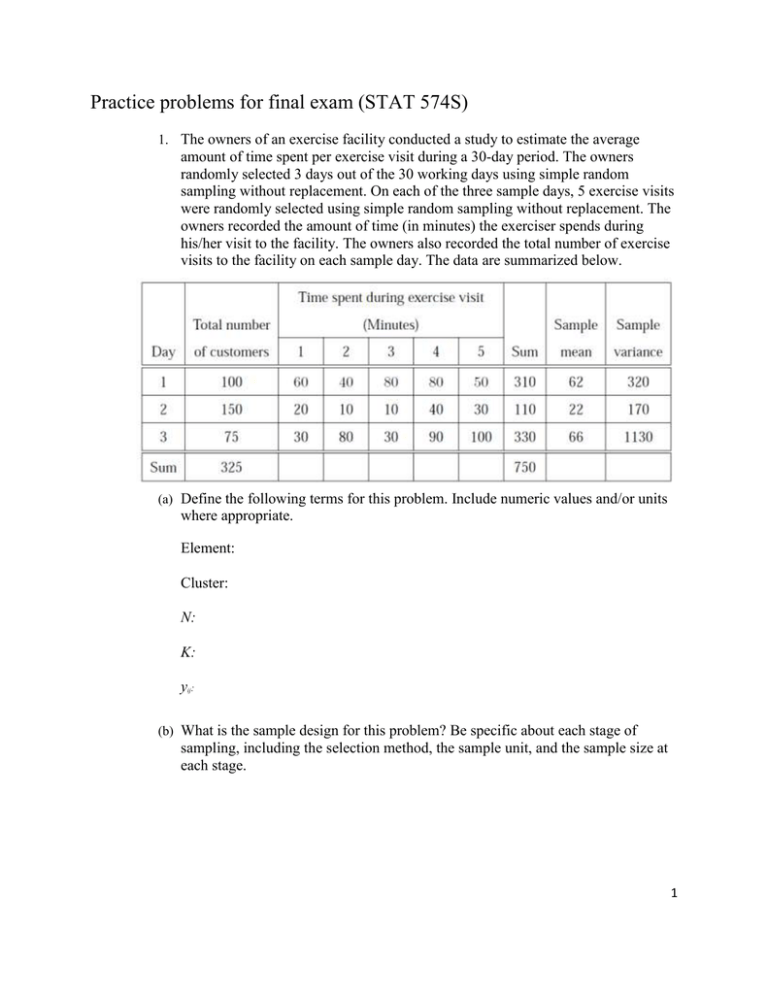
Practice problems for final exam (STAT 574S) 1. The owners of an exercise facility conducted a study to estimate the average amount of time spent per exercise visit during a 30-day period. The owners randomly selected 3 days out of the 30 working days using simple random sampling without replacement. On each of the three sample days, 5 exercise visits were randomly selected using simple random sampling without replacement. The owners recorded the amount of time (in minutes) the exerciser spends during his/her visit to the facility. The owners also recorded the total number of exercise visits to the facility on each sample day. The data are summarized below. (a) Define the following terms for this problem. Include numeric values and/or units where appropriate. Element: Cluster: N: K: yij: (b) What is the sample design for this problem? Be specific about each stage of sampling, including the selection method, the sample unit, and the sample size at each stage. 1 (c) Estimate the average amount of time spent per visit for the month. (d) Is the estimator you used in (c) unbiased? (e) Record the estimated variance formula for the estimator you used in (c). Define the notation used in the formula. (f) Suppose we calculate an approximate 90% confidence interval for the estimated TOTAL exercise visit time during the 30-day period using the unbiased estimator for the population total for this design. What is the interpretation of the confidence interval? 2. Below is a small population that has arranged in five clusters. For each cluster, the data values of the elements are listed, along with the cluster size and total for the data values in each cluster. Assume we wish to select a cluster sample with replacement from this population using probability proportional to the cluster size. a) What is the selection probability for cluster i = 4 ? 2 b) Suppose we draw a sample of n = 1 cluster and select cluster i = 4. Estimate the population total t based on this sample. c) Suppose we use the PPSWR design described in the introduction to this problem with n = 2 clusters. Assume that no cluster was selected more than once in our sample. What is the sample weight for the unbiased estimator under this design (provide a formula) ? d) Suppose cluster 1 and 2 were selected using the design in (c). Calculate the weight for cluster i = 2. Provide an interpretation of this weight. e) In general, under what conditions do you expect PPSWR with cluster size as the size measure to provide a more precise estimator of the population total than SRSWOR ? f) Describe a self-weighting two-stage design that uses the first stage PPSWR design described in (c), and uses SRSWOR to select elements within the sampled clusters 3. Consider the following population of 27 elements arranged in 9 groups of 3 elements each. For each of the elements, we have auxiliary information (x) available that is highly positively correlated with the characteristic of interest (y). 3 (a) Which of the following sample designs would be expected to yield the most precise estimate of a population parameter ? _____ Ignore the groupings and select a SRSWOR of 9 elements _____ Treating the groups as strata, select 1 element from each group _____ Treating the groups as clusters, select a SRS of 3 groups and include all elements from the sample groups (b) Justify your choice by considering each design. 4. For each of the following elements, indicate with a T (true) or a F (false) whether the statement is true or false. (a) ___ Ratio estimators are biased, but generally provide more precise estimates for population parameters if the auxiliary variable is positively correlated with the characteristic of interest (relative to the analogous unbiased estimator). (b) ___ In general, one should use SRS unless there are conditions that prevent one from using this method (such as the lack of a suitable sample frame). (c) ___ When the population is reasonably large, the sampling fraction is more important than the sample size in determining the precision of an estimate. (d) ___ A self-weighting design allows you to use SRS estimators for the population mean and for the variance of the estimated mean. 5. A labor economist wants to estimate the entry-level wage for grocery stores in 4 metropolitan areas. The economist has a sample frame that lists the 100 grocery stores located in these 4 areas. A simple random sample of 20 grocery stores was selected from 4 the population of grocery stores in the metropolitan areas. Half of the grocery stores sampled refused to participate in the study. The other half provided information on the entry-level wage. There were no funds to try to re-contact nonrespondents. The economist is given the table below, which lists results for each metropolitan area from the sampling process, the data collection process, as well as the average entry-level wage for each metropolitan area. (a) What is the response rate for this survey? (b) Which of the following 4 non-response adjustment methods would be the best strategy for this problem given what you know ? _____ Weighting class estimation _____ Post-stratification estimation _____ Imputation _____ A call-back study (double sampling) (c) Justify your choice by considering both practical and statistical factors for each of the options. 5


