Mapping Virtual Worlds and For more information, visit:
advertisement
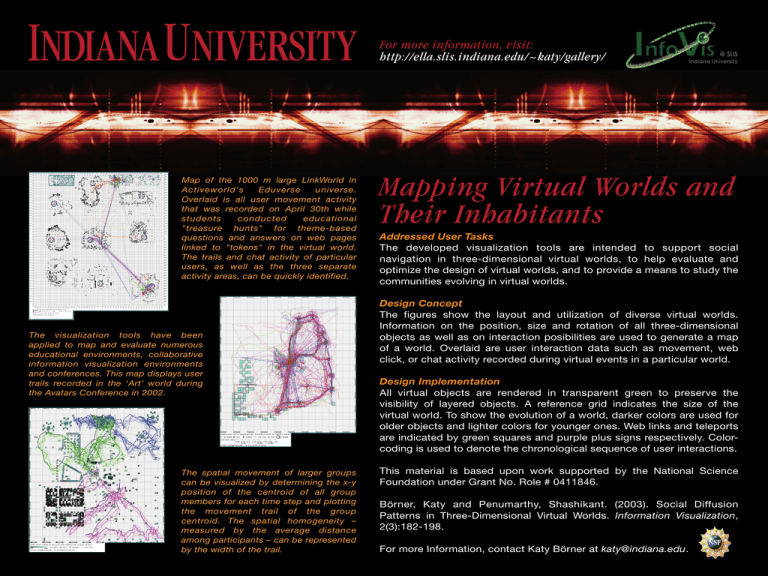
For more information, visit: http://ella.slis.indiana.edu/~katy/gallery/ Map of the 1000 m large LinkWorld in Activeworld's Eduverse universe. Overlaid is all user movement activity that was recorded on April 30th while students conducted educational "treasure hunts" for theme-based questions and answers on web pages linked to "tokens" in the virtual world. The trails and chat activity of particular users, as well as the three separate activity areas, can be quickly identified. The visualization tools have been applied to map and evaluate numerous educational environments, collaborative information visualization environments and conferences. This map displays user trails recorded in the ‘Art’ world during the Avatars Conference in 2002. The spatial movement of larger groups can be visualized by determining the x-y position of the centroid of all group members for each time step and plotting the movement trail of the group centroid. The spatial homogeneity – measured by the average distance among participants – can be represented by the width of the trail. Mapping Virtual Worlds and Their Inhabitants Addressed User Tasks The developed visualization tools are intended to support social navigation in three-dimensional virtual worlds, to help evaluate and optimize the design of virtual worlds, and to provide a means to study the communities evolving in virtual worlds. Design Concept The figures show the layout and utilization of diverse virtual worlds. Information on the position, size and rotation of all three-dimensional objects as well as on interaction posibilities are used to generate a map of a world. Overlaid are user interaction data such as movement, web click, or chat activity recorded during virtual events in a particular world. Design Implementation All virtual objects are rendered in transparent green to preserve the visibility of layered objects. A reference grid indicates the size of the virtual world. To show the evolution of a world, darker colors are used for older objects and lighter colors for younger ones. Web links and teleports are indicated by green squares and purple plus signs respectively. Colorcoding is used to denote the chronological sequence of user interactions. This material is based upon work supported by the National Science Foundation under Grant No. Role # 0411846. Börner, Katy and Penumarthy, Shashikant. (2003). Social Diffusion Patterns in Three-Dimensional Virtual Worlds. Information Visualization, 2(3):182-198. For more Information, contact Katy Börner at katy@indiana.edu.
