Scalable Multi-Scale Visual Analytical Tools for NCATS
advertisement
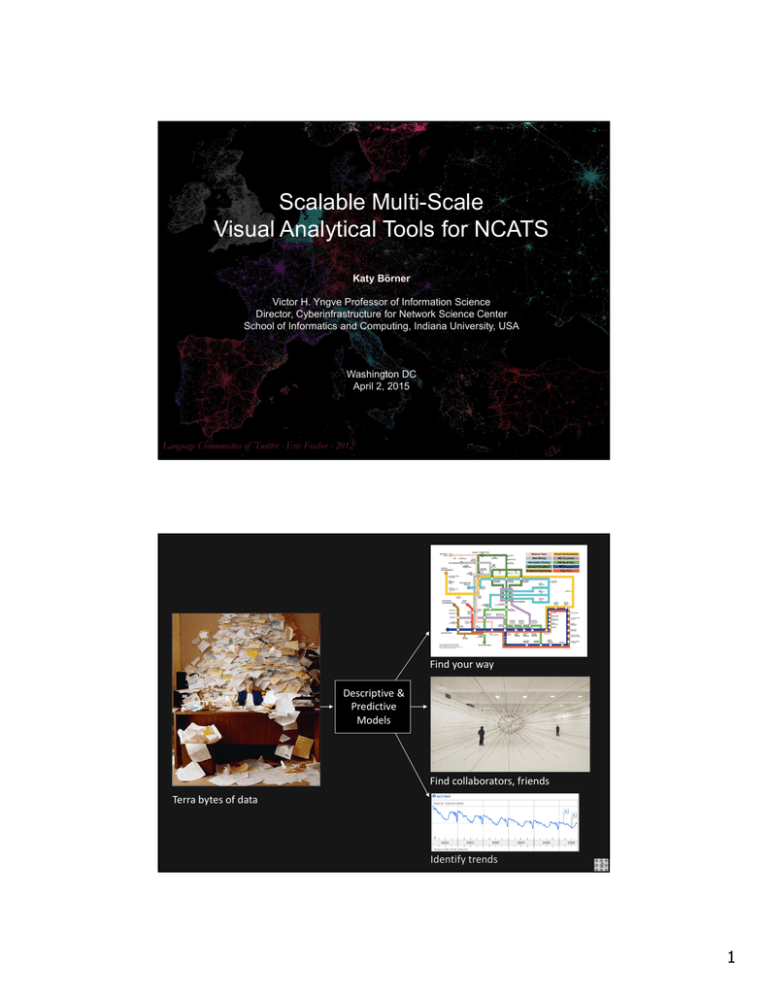
Scalable Multi-Scale Visual Analytical Tools for NCATS Katy Börner Victor H. Yngve Professor of Information Science Director, Cyberinfrastructure for Network Science Center School of Informatics and Computing, Indiana University, USA Washington DC April 2, 2015 Language Communities of Twitter - Eric Fischer - 2012 Find your way Descriptive & Predictive Models Find collaborators, friends Terra bytes of data Identify trends 2 1 Scalable Multi‐Scale Visual Analytical Tools for NCATS— Questionnaire Results Number of responses: 5 NIH, 4 NCATS, possible overlap Gender: 5 female, 4 male Median age: 38 (average Twitter user is 37.3 years old) Academic background: Microbiology, bioinformatics, informatics, computer science, epidemiology, pharma, physics, physician Native Language: 9 English 3 Scalable Multi‐Scale Visual Analytical Tools for NCATS— Questionnaire Results NIH: In your daily work, what datasets do you use? Medline Publications, NIH Awards, USTO Patents, Clinical Trials, Program Management, bioactivity data, LinkedIn, ResearchGate NCATS: What systems/databases do you use? Medline Publications, eRA (IMPACT, QVR, xTrain), Clinical Trials, Excel, APR, LinkedIn, Research Gate 4 2 Scalable Multi‐Scale Visual Analytical Tools for NCATS— Questionnaire Results NIH or NCATS WHEN NIH NIH WHAT AREAS 1 1 WITH WHOM WHERE 1 1 NIH 1 1 1 1 NIH 1 1 1 1 NIH 1 1 1 1 NCATS 1 1 1 1 NCATS 1 1 1 1 NCATS 1 1 1 1 NCATS 1 1 1 TOTALS 8 9 8 6 5 Scalable Multi‐Scale Visual Analytical Tools for NCATS— Questionnaire Results Bursts of NCATS/NI Tweets/Topics NIH 1 NIH NIH 1 NIH 1 NIH 1 NCATS NCATS 1 NCATS 1 NCATS TOTALS 6 $ Diffusion of Translation Ideas Experts Experts 1 1 1 1 1 1 1 1 1 1 1 6 5 1 1 1 3 1 1 1 3 1 1 1 3 6 3 Descriptive Models Multiple levels: Micro … Macro Answering: When? Where? What? With Whom? 7 Different Levels of Abstraction/Analysis Macro/Global Population Level Meso/Local Group Level Micro Individual Level 8 4 Type of Analysis vs. Level of Analysis Micro/Individual (1‐100 records) Meso/Local (101–100,000 records) Macro/Global (100,000 < records) Statistical Analysis/Profiling Individual person and their expertise profiles Larger labs, centers, universities, research domains, or states All of NSF, all of USA, all of science. Temporal Analysis (When?) Funding portfolio of one individual Mapping topic bursts in 113 Years of Physics 20‐years of PNAS Research Geospatial Analysis Career trajectory of one Mapping a states (Where?) individual intellectual landscape PNAS publications Topical Analysis (What?) Base knowledge from which one grant draws. Knowledge flows in Chemistry research VxOrd/Topic maps of NIH funding Network Analysis (With Whom?) NSF Co‐PI network of one individual Co‐author network NIH’s core competency 9 Type of Analysis vs. Level of Analysis Micro/Individual (1‐100 records) Meso/Local (101–100,000 records) Macro/Global (100,000 < records) Statistical Analysis/Profiling Individual person and their expertise profiles Larger labs, centers, universities, research domains, or states All of NSF, all of USA, all of science. Temporal Analysis (When?) Funding portfolio of one individual Mapping topic bursts in 113 Years of Physics 20‐years of PNAS Research Geospatial Analysis Career trajectory of one Mapping a states (Where?) individual intellectual landscape PNAS publications Topical Analysis (What?) Base knowledge from which one grant draws. Knowledge flows in Chemistry research VxOrd/Topic maps of NIH funding Network Analysis (With Whom?) NSF Co‐PI network of one individual Co‐author network NIH’s core competency 10 5 Individual Co‐PI Network 1 Ke & Börner. 2006. 11 Mapping the Evolution of Co‐Authorship Networks Ke, Visvanath & Börner. 2004. Won 1st prize at the IEEE InfoVis Contest. 12 6 Mapping the Evolution of Co‐Authorship Networks 2 Ke, Visvanath & Börner. 2004. Won 1st prize at the IEEE InfoVis Contest. 13 3 Mapping Indiana’s Intellectual Space Identify Pockets of innovation Pathways from ideas to products Interplay of industry and academia 14 7 Mapping Transdisciplinary Tobacco Use Research Centers Publications 4 Compare R01 investigator‐based funding with TTURC Center awards in terms of number of publications and evolving co‐author networks. Stipelman, Hall, Zoss, Okamoto, Stokols, Börner, 2014. Supported by NIH/NCI Contract HHSN261200800812 15 Research Collaborations by the Chinese Academy of Sciences 5 Huang, Duhon, Hardy & Börner 16 8 6 Language Communities of Twitter ‐ Eric Fischer ‐ 2012 17 7 Council for Chemical Research. 2009. Chemical R&D Powers the U.S. Innovation Engine. Washington, DC. Courtesy of the Council for Chemical Research. 18 9 Empowering Anyone to Visualize STI Example: The Information Visualization MOOC 19 Register for free at http://ivmooc.cns.iu.edu. Class restarted in January 13, 2015. 20 10 8 Course Schedule Part 1: Theory and Hands‐On • Session 1 – Workflow Design and Visualization Framework • Session 2 – “When:” Temporal Data • Session 3 – “Where:” Geospatial Data • Session 4 – “What:” Topical Data Mid‐Term • Session 5 – “With Whom:” Trees • Session 6 – “With Whom:” Networks • Session 7 – Dynamic Visualizations and Deployment Final Exam Part 2: Students work in teams on client projects. Final grade is based on Class Participation (10%), Midterm (30%), Final Exam (30%), and Client Project(30%). 21 Books Used in the IVMOOC Teaches timely knowledge: Advanced algorithms, tools, and hands‐on workflows. Teaches timeless knowledge: Visualization framework— exemplified using generic visualization examples and pioneering visualizations. 22 11 Tasks See page 5 23 Needs‐Driven Workflow Design DEPLOY Validation Interpretation Stakeholders Visually encode data Types and levels of analysis determine data, algorithms & parameters, and deployment Overlay data Data Select visualiz. type READ ANALYZE VISUALIZE 12 Needs‐Driven Workflow Design DEPLOY Validation Interpretation Stakeholders Visually encode data Types and levels of analysis determine data, algorithms & parameters, and deployment Overlay data Data Select visualiz. type READ See page 36 ANALYZE VISUALIZE 26 13 See pages 36‐39 27 Load One File and Run Many Analyses and Visualizations Times Publication City of Cited Year Publisher 12 2011 NEW YORK Country Journal Title (Full) USA COMMUNICA TIONS OF THE ACM MALDEN USA CTSCLINICAL AND TRANSLATIO NAL SCIENCE WASHINGTON USA SCIENCE TRANSLATIO NAL MEDICINE Title 18 2010 Advancing the Science of Research & Team Science Experimental Medicine Falk-Krzesinski, HJ|Borner, K|Contractor, N|Fiore, SM|Hall, KL|Keyton, J|Spring, B|Stokols, D|Trochim, W|Uzzi, B 13 2010 A Multi-Level Systems Cell Biology Perspective for the |Research & Science of Team Science Experimental Medicine Borner, K|Contractor, N|FalkKrzesinski, HJ|Fiore, SM|Hall, KL|Keyton, J|Spring, B|Stokols, D|Trochim, W|Uzzi, B Plug-and-Play Macroscopes Subject Category Computer Science Authors Borner, K 28 14 Load One File and Run Many Analyses and Visualizations Times Publication City of Cited Year Publisher 12 2011 NEW YORK 18 2010 13 2010 Country Journal Title (Full) COMMUNICA TIONS OF THE ACM MALDEN USA CTSCLINICAL AND TRANSLATIO NAL SCIENCE WASHINGTON USA SCIENCE TRANSLATIO NAL MEDICINE USA Title Plug-and-Play Macroscopes Subject Category Computer Science Authors Borner, K Advancing the Science of Research & Team Science Experimental Medicine Falk-Krzesinski, HJ|Borner, K|Contractor, N|Fiore, SM|Hall, KL|Keyton, J|Spring, B|Stokols, D|Trochim, W|Uzzi, B Cell Biology A Multi-Level Systems |Research & Perspective for the Science of Team Science Experimental Medicine Borner, K|Contractor, N|FalkKrzesinski, HJ|Fiore, SM|Hall, KL|Keyton, J|Spring, B|Stokols, D|Trochim, W|Uzzi, B Co‐author and many other bi‐modal networks. 29 READINGS Papers • Stipelman, Brooke A., Hall, Kara L., Zoss, Angela, Okamoto, Janet, Stokols, Dan, and Börner, Katy (2014) Mapping the Impact of Transdisciplinary Research: A Visual Comparison of Investigator Initiated and Team Based Tobacco Use Research Publications. The Journal of Translational Medicine and Epidemiology. • Bollen, Johan, David Crandall, Damion Junk, Ying Ding, and Katy Börner. 2014. From funding agencies to scientific agency: Collective allocation of science funding as an alternative to peer review. EMBO Reports 15 (1): 1‐121. • Mazloumian, Amin, Dirk Helbing, Sergi Lozano, Robert Light, and Katy Börner. 2013. Global Multi‐Level Analysis of the 'Scientific Food Web'. Scientific Reports 3, 1167. Books • Börner, Katy. 2015. Atlas of Knowledge: Anyone Can Map. The MIT Press. • Börner, Katy, and David E. Polley. 2014. Visual Insights: A Practical Guide to Making Sense of Data. Cambridge, MA: The MIT Press. • Scharnhorst, Andrea, Katy Börner, and Peter van den Besselaar, eds. 2012. Models of Science Dynamics. Springer Verlag. • Börner, Katy, Mike Conlon, Jon Corson‐Rikert, and Ying Ding, eds. 2012. VIVO: A Semantic Approach to Scholarly Networking and Discovery. Morgan & Claypool Publishers LLC. • Börner, Katy. 2010. Atlas of Science: Visualizing What We Know. The MIT Press. 30 15 VATS Visualizations: Existing Interfaces Existing Interfaces for VATS-like data 9) NIH RePORTER: Visual Interface to Biomedical Funding Data in U.S. 10) CIShell/Sci2 World and Science Visualizations of NIH RePORTER Data 11) NIH RePORTER: NIH Map 12) BBSRC: Visual Interface to Biomedical Funding Data in UK 13) IAI Multidimensional Analysis 14) Scraawl: Twitter Analysis 15) Illuminated Diagram: Searchable World and Science Maps VATS Visualizations: Existing Interfaces NIH RePORTER: Visual Interface to Biomedical Funding Data in US 9 http://projectreporter.nih.gov/ 16 VATS Visualizations: Existing Interfaces CIShell/Sci2 World and Science Visualizations of NIH RePORTER Data 10 VATS Visualizations: Existing Interfaces Sci2 Desktop 17 VATS Visualizations: Existing Interfaces NIH RePORTER: NIH Map 11 http://nihmaps.org/ VATS Visualizations: Existing Interfaces BBSRC: Visual Interface to Biomedical Funding Data in UK 12 http://www.bbsrc.ac.uk/ 18 VATS Visualizations: Existing Interfaces BBSRC: Temporal animation VATS Visualizations: Existing Interfaces IAI Multidimensional Analysis 13 19 VATS Visualizations: Existing Interfaces Scraawl: Twitter Analysis 14 https://www.scraawl.com/ VATS Visualizations: Existing Interfaces Scraawl: Advanced analysis 20 VATS Visualizations: Existing Interfaces Illuminated Diagram: Searchable World and Science Maps 15 http://cns.iu.edu/interactive_displays.html VATS Visualizations: Existing Interfaces Illuminated Diagram: Search detail 21 References Börner, Katy, Chen, Chaomei, and Boyack, Kevin. (2003). Visualizing Knowledge Domains. In Blaise Cronin (Ed.), ARIST, Medford, NJ: Information Today, Volume 37, Chapter 5, pp. 179‐255. http://ivl.slis.indiana.edu/km/pub/2003‐ borner‐arist.pdf Shiffrin, Richard M. and Börner, Katy (Eds.) (2004). Mapping Knowledge Domains. Proceedings of the National Academy of Sciences of the United States of America, 101(Suppl_1). http://www.pnas.org/content/vol101/suppl_1/ Börner, Katy (2010) Atlas of Science: Visualizing What We Know. The MIT Press. http://scimaps.org/atlas Scharnhorst, Andrea, Börner, Katy, van den Besselaar, Peter (2012) Models of Science Dynamics. Springer Verlag. Katy Börner, Michael Conlon, Jon Corson‐Rikert, Cornell, Ying Ding (2012) VIVO: A Semantic Approach to Scholarly Networking and Discovery. Morgan & Claypool. Katy Börner and David E Polley (2014) Visual Insights: A Practical Guide to Making Sense of Data. The MIT Press. Börner, Katy (2015) Atlas of Knowledge: Anyone Can Map. The MIT Press. http://scimaps.org/atlas2 43 All papers, maps, tools, talks, press are linked from http://cns.iu.edu These slides will soon be at http://cns.iu.edu/docs/presentations CNS Facebook: http://www.facebook.com/cnscenter Mapping Science Exhibit Facebook: http://www.facebook.com/mappingscience 44 22
