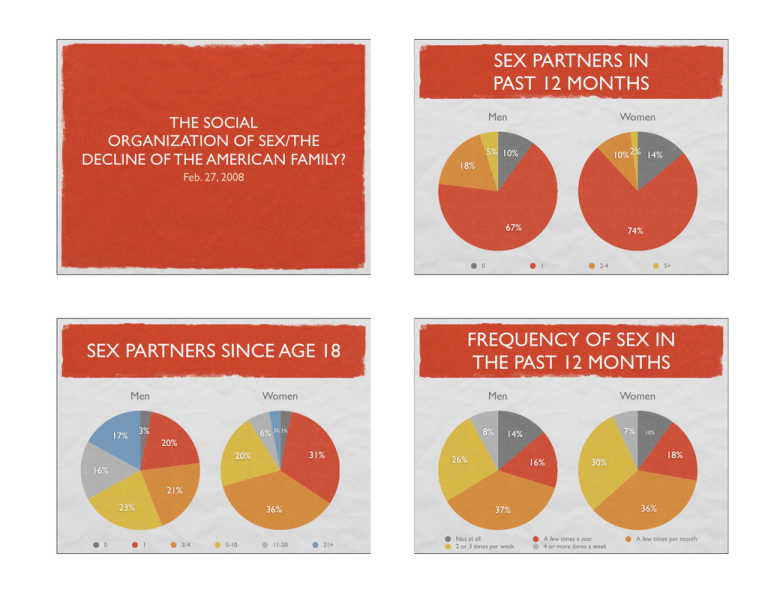
SEX PARTNERS IN
PAST 12 MONTHS
THE SOCIAL
ORGANIZATION OF SEX/THE
DECLINE OF THE AMERICAN FAMILY?
Feb. 27, 2008
Men
Women
10% 2% 14%
5% 10%
18%
67%
0
SEX PARTNERS SINCE AGE 18
Men
17%
8%
31%
20%
2-4
Men
6% 3% 3%
20%
1
16%
5+
FREQUENCY OF SEX IN
THE PAST 12 MONTHS
Women
3%
74%
Women
7%
14%
26%
16%
10%
18%
30%
21%
23%
0
36%
1
2-4
5-10
11-20
36%
37%
21+
Not at all
2 or 3 times per week
A few times a year
4 or more times a week
A few times per month
FREQUENCY OF SEX BY AGE
100%
75%
50%
25%
0%
52%
44%
92% 91%
Noncohabitating
86%
Cohabitating
Men
86%
Married
Women
Percent extremely or very satisfied with sexual relationship
SEXUAL SATISFACTION
BY TYPE OF UNION
Have sex at least a few times or more per month
Have sex at least a few times or more per month
FREQUENCY OF SEX
BY TYPE OF UNION
100%
85%
73%
76%
73%
75%
78%
64%
66%
75%
69%
50%
49%
25%
0%
18-24
25-29
30-39
Men
40-49
50-59
Women
MEASURING
HOMOSEXUALITY
90.0%
67.5%
45.0%
22.5%
0%
78.2% 71.0%
84.4% 75.6%
87.4% 84.8%
Noncohabitating
Cohabitating
Married
Physical pleasure
Kinsey emphasized continuum of sexuality
Lifetime male-male sexual contact (37%)
10% had only homosexual experience during
any three-year period between 16-55
4% reported sex only with men since
adolescence
NHSLS studied three aspects of homosexuality
Desire: same-sex sexual attraction
Behavior: having same-sex sex
Identification
Emotional satisfaction
© David Schweingruber 2008
DIFFERENT MEASURES OF
HOMOSEXUALITY
INTERRELATIONS OF COMPONENTS
OF HOMOSEXUALITY
10.0%
Men (10.1%)
Desire
7.5%
59%
5.0%
13%
6.2% 4.4% 4.5% 5.6%
2.5%
4.1%
2.8%
1.4%
0%
Behavior
2.7%
1.3%
2.2%
Same-sex attraction
Identification
Sex in past 5 years
Sex since puberty
Same-sex sex appealing
Sex in past 12 months
Sex since 18
Men
Women
The 2002 National Study of Family Growth found higher rates
of identification: 3 times for women and 1.5 times for men.
1%
Desire
15%
4.9% 4.1% 9.1% 4.3%
13%
0%
44%
Identity
6%
0%
24%
Behavior
Women (8.6%)
1%
22%
0%
Identity
2%
© David Schweingruber 2008
IS THE AMERICAN FAMILY
DECLINING?
© David Schweingruber 2008
WHAT ABOUT THE 1950S?
Evidence of decline: divorce, single-parent families,
unsupervised children
However, there has been no golden age of the
American family. Each generation has believed the
family was declining.
Children in the 19th Century were more likely to
live in single-parent families than today
In 1900, 20% of children lived in orphanages
In 1900, rates of alcohol & drug abuse, school
dropouts and domestic violence were higher
than today
Extended family rates have never risen above
20%
1950s weren’t as we remember them
< 60% of children lived in “traditional” family
Many women were unhappy with non-work role
Blacks faced worse discrimination than later decades
1950s family was “experimental,” not “traditional”
Dad-works, mom-stays-home model began in 19th century
Women began entering office jobs in 1920s
After WWII many women left factories for home
But female labor market participation began rising again in
1950s
© David Schweingruber 2008
© David Schweingruber 2008

