Chapter 3-5 Airline Economics, Markets & Demand, Cost 1.
advertisement
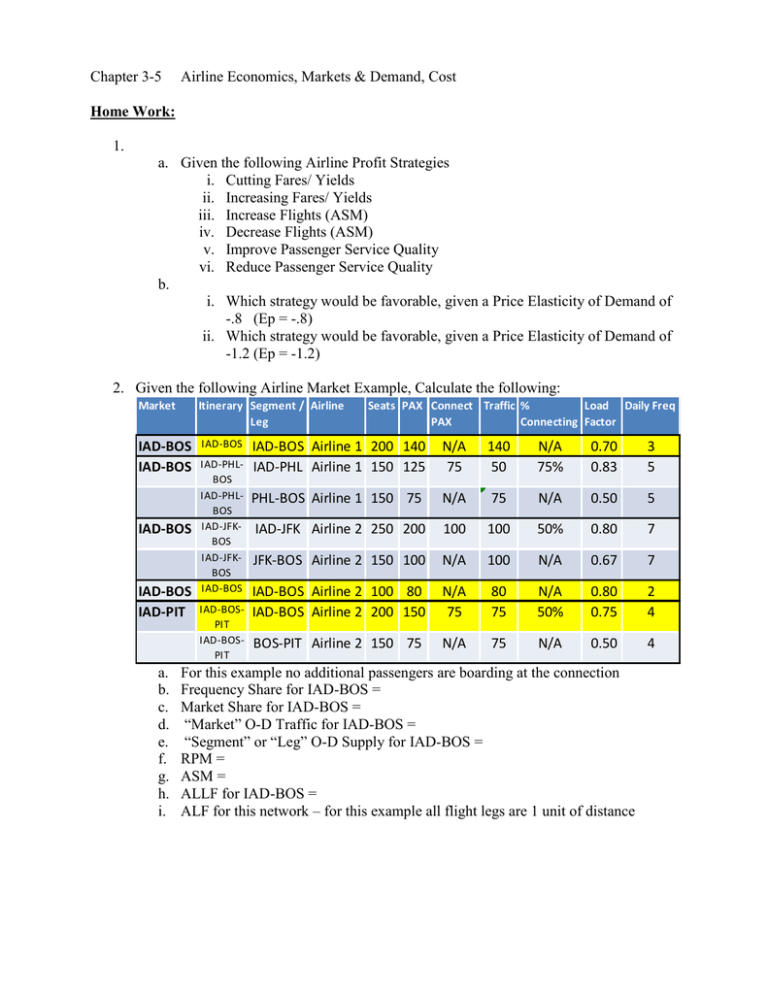
Chapter 3-5 Airline Economics, Markets & Demand, Cost Home Work: 1. a. Given the following Airline Profit Strategies i. Cutting Fares/ Yields ii. Increasing Fares/ Yields iii. Increase Flights (ASM) iv. Decrease Flights (ASM) v. Improve Passenger Service Quality vi. Reduce Passenger Service Quality b. i. Which strategy would be favorable, given a Price Elasticity of Demand of -.8 (Ep = -.8) ii. Which strategy would be favorable, given a Price Elasticity of Demand of -1.2 (Ep = -1.2) 2. Given the following Airline Market Example, Calculate the following: Market Itinerary Segment / Airline Leg IAD-BOS IAD-BOS IAD-BOS IAD-BOS IAD-BOS IAD-PIT a. b. c. d. e. f. g. h. i. IAD-PHLBOS IAD-PHLBOS IAD-JFKBOS IAD-JFKBOS IAD-BOS IAD-BOSPIT IAD-BOSPIT Seats PAX Connect Traffic % Load Daily Freq PAX Connecting Factor IAD-BOS Airline 1 200 140 IAD-PHL Airline 1 150 125 N/A 75 140 50 N/A 75% 0.70 0.83 3 5 PHL-BOS Airline 1 150 75 N/A 75 N/A 0.50 5 IAD-JFK Airline 2 250 200 100 100 50% 0.80 7 JFK-BOS Airline 2 150 100 N/A 100 N/A 0.67 7 IAD-BOS Airline 2 100 80 IAD-BOS Airline 2 200 150 N/A 75 80 75 N/A 50% 0.80 0.75 2 4 BOS-PIT Airline 2 150 75 N/A 75 N/A 0.50 4 For this example no additional passengers are boarding at the connection Frequency Share for IAD-BOS = Market Share for IAD-BOS = “Market” O-D Traffic for IAD-BOS = “Segment” or “Leg” O-D Supply for IAD-BOS = RPM = ASM = ALLF for IAD-BOS = ALF for this network – for this example all flight legs are 1 unit of distance 3. Given the following flight performance data for 7/7/2007 departures from JFK to ORD: min min min $/min FLTNO TAILNO gate delay taxi delay air delay no_seats seat_group maint 1066 CCA1066 389 23 10 416 325 $ 18 83 N804CA 30 52.2 4 50 50 $ 5 447 N936CA 0 14.2 7 50 50 $ 5 469 N398CA 0 28.2 3 50 50 $ 5 492 N956CA 0 20.2 5 50 50 $ 5 634 N964CA 28 17.2 4 50 50 $ 5 85 CPA85 0 0 3 416 325 $ 18 133 N689EC 0 15.6 1 50 50 $ 5 392 N632AE 0 20.6 0 50 50 $ 5 903 N506JB 0 3.9 0 164 175 $ 7 907 N249JB 0 35.9 10 98 100 $ 6 915 N509JB 24 0.9 3 164 175 $ 7 917 N249JB 0 10.9 6 98 100 $ 6 919 N548JB 41 25.9 0 164 175 $ 7 8624 WOA8624 7 15 6 323 325 $ 18 $/min crew $ 37 $ 9 $ 9 $ 9 $ 9 $ 9 $ 37 $ 9 $ 9 $ 14 $ 13 $ 14 $ 13 $ 14 $ 37 $/min taxi fuel $ 5.79 $ 0.73 $ 0.73 $ 0.73 $ 0.73 $ 0.73 $ 5.79 $ 0.73 $ 0.73 $ 2.09 $ 1.42 $ 2.09 $ 1.42 $ 2.09 $ 5.79 And the following delay cost model: Crew Coefficient Other Cost <= 15 min >=65 min $/min Gate Delay 0.03 0.46 $ 0.21 Taxi Delay 0 0.43 $ 0.12 Air Delay 0.01 0.46 $ 0.10 a. Calculate total gate, taxi, and air delay costs. b. Which aircraft seat group had the greatest gate, taxi, and air delay costs? $/min fuel $116 $ 15 $ 15 $ 15 $ 15 $ 15 $116 $ 15 $ 15 $ 42 $ 28 $ 42 $ 28 $ 42 $116 4. Given the following information about the JFK-MCO market: Average 9 flights per day Average 3240 passengers per day $130 Average Fare LF=.8 Revenue = Demand*Price = Demand*(Ln(Demand) - Ln(M) )/Coeff Coeff = -0.011 M = 7884.4 Cost = # flights * (landing Fee + avg hrs * (DOCless fuel/hr + Burn Rate * fuel price)) Demand = # flights * Aircraft Size * LF JFK-MCO WTP Curve 3500 y = 7884.4e-0.011x R² = 0.9347 3000 cum demand Expon. (cum … Cumulative Demand 2500 2000 1500 1000 500 0 0 100 200 300 400 500 600 700 800 Average Airfare Seats 25 50 75 100 125 150 175 200 225 250 275 300 325 .8 load factor Burn Rate DOC-Fuel/Hr fuel price 20 202 $ 640 $2 40 435 $ 854 $2 60 458 $ 779 $2 80 854 $ 1,154 $2 100 844 $ 1,074 $2 120 963 $ 1,150 $2 140 1,252 $ 1,277 $2 160 1,428 $ 649 $2 180 1,723 $ 1,786 $2 200 1,942 $ 1,842 $2 220 2,236 $ 1,377 $2 240 3,125 $ 3,084 $2 260 3,471 $ 3,301 $2 landing fees MCO hrs Cost per flight seat cost per flight $ 112 2.50 $2,720.10 $108.80 $ 137 2.50 $4,448.70 $88.97 $ 218 2.48 $4,426.13 $59.02 $ 330 2.48 $7,437.46 $74.37 $ 356 2.88 $8,320.10 $66.56 $ 367 2.67 $8,571.32 $57.14 $ 686 2.72 $10,959.68 $62.63 $ 546 2.63 $9,772.95 $48.86 $ 945 2.77 $15,423.23 $68.55 $ 904 2.77 $16,762.87 $67.05 $ 904 2.80 $17,280.69 $62.84 $ 904 2.80 $27,039.50 $90.13 $ 904 2.80 $29,584.54 $91.03 a. Calculate and plot Revenue (y axis) versus demand (x axis), Cost (y axis) versus demand (x axis), and profit (y axis) versus demand (x axis) for all “Seats” shown in the table above. Note: Demand = .8*seat size. i. 5 flights per day ii. 10 flights per day iii. 20 flights per day b. Using the charts from part (a), what aircraft size and average airfare is the most profitable for: i. 5 flights per day ii. 10 flights per day iii. 20 flights per day


