Document 10743357
advertisement

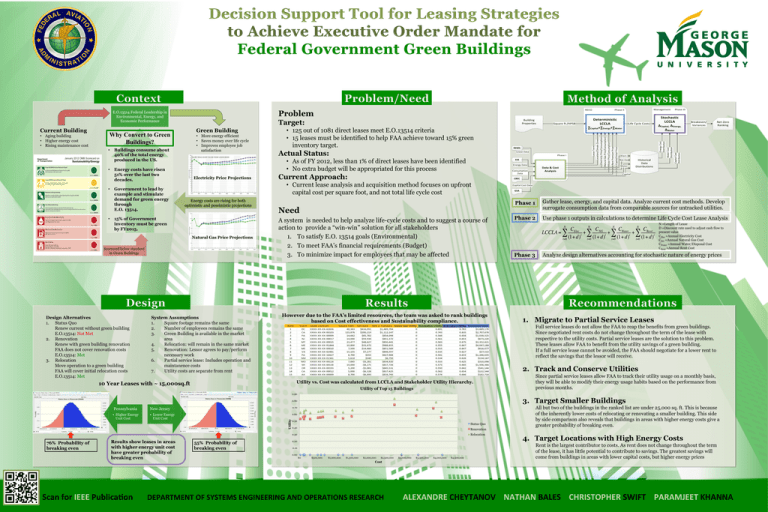
January 2012 OMB Scorecard on Sustainability/Energy Scope 1&2 GHG Emission Reduction Target For Scope 1&2 GHG ReductionTarget of 12.3% by 2020: 17.8% reduction in 2011 and on track Score: GREEN Scope 3 GHG Emission Reduction Target • More energy efficient • Saves money over life cycle • Improves employee job satisfaction • Buildings consume about 40% of the total energy produced in the US. Reduction in Energy Intensity • Energy costs have risen 51% over the last two decades. Reduction in energy intensity in goal-subject facilities compared with 2003: 26.4% and on track for 30% by 2015 Score: GREEN Use of Renewable Energy Use of renewable energy as a percent of facility electricity use: Total of 8.4% from renewable electricity sources including at least 2.5% from new sources (thermal, mechanical, or electric) • Government to lead by example and stimulate demand for green energy through E.O. 13514. Electricity Price Projections Reduction in potable water intensity compared with 2007: 9.7% increase and not on track Score: RED Reduction in Fleet Petroleum Use Energy costs are rising for both optimistic and pessimistic projections • 15% of Government inventory must be green by FY2015. Reduction in fleet petroleum use compared to 2005: 4.9% and not on track Natural Gas Price Projections Score: RED Green Buildings Sustainable green buildings: 0.51% of buildings sustainable 0.53% GSF of inventory sustainable, as reported in FRPP Score: RED Scorecard below standard in Green Buildings Design Alternatives 1. Status Quo Renew current without green building E.O.13514: Not Met 2. Renovation Renew with green building renovation FAA does not cover renovation costs E.O.13514: Met 3. Relocation Move operation to a green building FAA will cover initial relocation costs E.O.13514: Met Phase I EIA Energy Data Consumption Data Current Approach: System Assumptions 1. Square footage remains the same 2. Number of employees remains the same 3. Green Building is available in the market area 4. Relocation: will remain in the same market 5. Renovation: Lessor agrees to pay/perform necessary work 6. Partial service lease: Includes operation and maintanence costs 7. Utility costs are separate from rent Data & Cost Analysis Life Cycle Costs Elect. Nat.Gas Water Historical Data Distributions Stochastic LCCLA ΔCapital, ΔEnergy, ΔWater Breakeven/ Variances Net-­‐Zero Ranking Capital CBEC • Current lease analysis and acquisition method focuses on upfront capital cost per square foot, and not total life cycle cost Score: GREEN Reduction in Potable Water Intensity Actual Status: REMS Lease Data • As of FY 2012, less than 1% of direct leases have been identified • No extra budget will be appropriated for this process For Scope 3 GHG ReductionTarget of 11% by 2020: 0.1% reduction in 2011 and behind schedule Score: YELLOW • 125 out of 1081 direct leases meet E.O.13514 criteria • 15 leases must be identified to help FAA achieve toward 15% green inventory target. Square ft./HPSB Deterministic LCCLA ∑Capital+∑Energy+∑Water Energy Cost Distribution Water Cost Distribution Capital Cost Distribution Green Building Why Convert to Green Buildings? • Aging building • Higher energy cost • Rising maintenance cost Department of Transportation Target: Building Properties Management Phase III Phase II Lease Term Location/Climate Zone Electricity Price/Consumption Natural Gas Price/Consumption Water Price/Consumption Rent Premium Price Capital/Initial Price Current Building RECO Problem E.O.13514 Federal Leadership in Environmental, Energy, and Economic Performance Need A system is needed to help analyze life-cycle costs and to suggest a course of action to provide a “win-win” solution for all stakeholders 1. To satisfy E.O. 13514 goals (Environmental) 2. To meet FAA’s financial requirements (Budget) 3. To minimize impact for employees that may be affected However due to the FAA’s limited resources, the team was asked to rank buildings based on Cost effectiveness and Sustainability compliance. Capital Cost Data GSA Phase 1 Gather lease, energy, and capital data. Analyze current cost methods. Develop surrogate consumption data from comparable sources for untracked utilities. Phase 2 Use phase 1 outputs in calculations to determine Life Cycle Cost Lease Analysis N N N N CElec CNG CWater CRe nt LCCLA = ∑ +∑ +∑ +∑ t t t t (1+ d) (1+ d) (1+ d) (1+ d) t=0 t=0 t=0 t=0 Phase 3 N =Length of Lease D =Discount rate used to adjust cash flow to present value CElec =Annual Electricity Cost CNG =Annual Natural Gas Cost CWater =Annual Water/Disposal Cost CRent =Annual Rent Cost Analyze design alternatives accounting for stochastic nature of energy prices 1. Migrate to Partial Service Leases Full service leases do not allow the FAA to reap the benefits from green buildings. Since negotiated rent costs do not change throughout the term of the lease with respective to the utility costs. Partial service leases are the solution to this problem. These leases allow FAA to benefit from the utility savings of a green building. If a full service lease cannot be avoided, the FAA should negotiate for a lower rent to reflect the savings that the lessor will receive. 2. Track and Conserve Utilities Utility vs. Cost was calculated from LCCLA and Stakeholder Utility Hierarchy. 10 Year Leases with ~ 15,000sq.ft Utility of Top 15 Buildings Since partial service leases allow FAA to track their utility usage on a monthly basis, they will be able to modify their energy usage habits based on the performance from previous months. 0.90 3. Target Smaller Buildings 0.80 76% Probability of breaking even New Jersey 0.70 • Higher Energy Unit Cost • Lower Energy Unit Cost 0.60 Results show leases in areas with higher energy unit cost have greater probability of breaking even Scan for IEEE PublicaCon Utility Pennsylvania 55% Probability of breaking even 0.50 Status Quo 0.40 Renovation 0.30 Relocation 0.20 0.10 0.00 $0 $500,000 $1,000,000 $1,500,000 $2,000,000 $2,500,000 $3,000,000 $3,500,000 $4,000,000 $4,500,000 All but two of the buildings in the ranked list are under 25,000 sq. ft. This is because of the inherently lower costs of relocating or renovating a smaller building. This side by side comparison also reveals that buildings in areas with higher energy costs give a greater probability of breaking even. 4. Target Locations with High Energy Costs Rent is the largest contributor to costs. As rent does not change throughout the term of the lease, it has little potential to contribute to savings. The greatest savings will come from buildings in areas with lower capital costs, but higher energy prices Cost DEPARTMENT OF SYSTEMS ENGINEERING AND OPERATIONS RESEARCH ALEXANDRE CHEYTANOV NATHAN BALES CHRISTOPHER SWIFT PARAMJEET KHANNA


