STAT 511 Assignment 1 Name ________________
advertisement
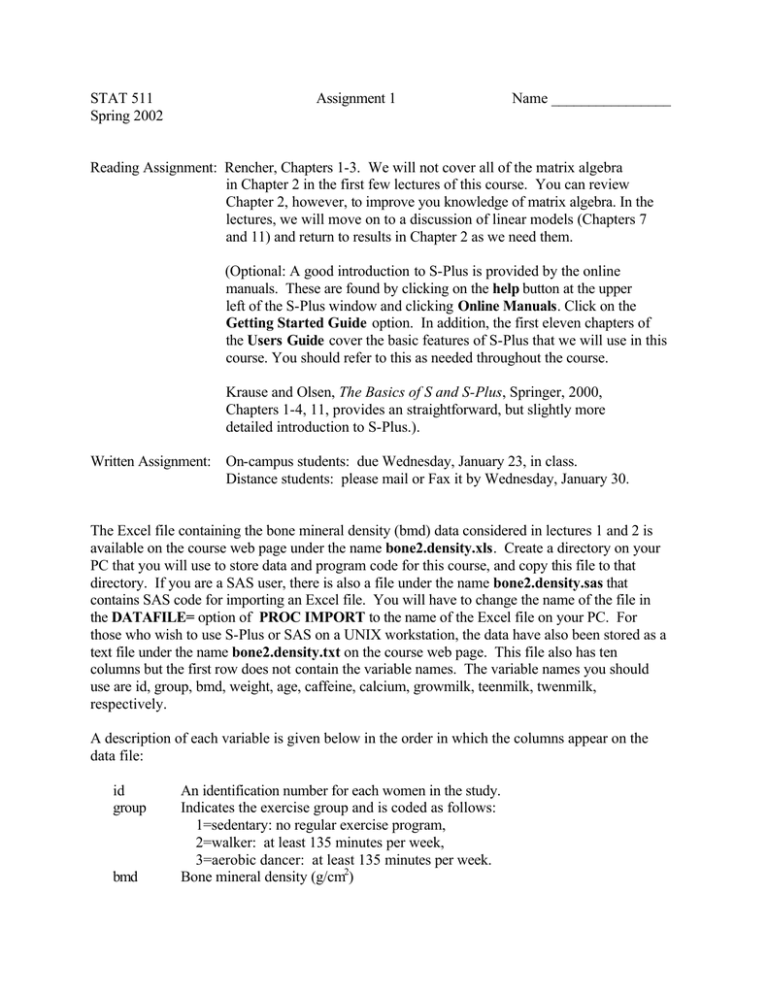
STAT 511 Spring 2002 Assignment 1 Name ________________ Reading Assignment: Rencher, Chapters 1-3. We will not cover all of the matrix algebra in Chapter 2 in the first few lectures of this course. You can review Chapter 2, however, to improve you knowledge of matrix algebra. In the lectures, we will move on to a discussion of linear models (Chapters 7 and 11) and return to results in Chapter 2 as we need them. (Optional: A good introduction to S-Plus is provided by the online manuals. These are found by clicking on the help button at the upper left of the S-Plus window and clicking Online Manuals. Click on the Getting Started Guide option. In addition, the first eleven chapters of the Users Guide cover the basic features of S-Plus that we will use in this course. You should refer to this as needed throughout the course. Krause and Olsen, The Basics of S and S-Plus, Springer, 2000, Chapters 1-4, 11, provides an straightforward, but slightly more detailed introduction to S-Plus.). Written Assignment: On-campus students: due Wednesday, January 23, in class. Distance students: please mail or Fax it by Wednesday, January 30. The Excel file containing the bone mineral density (bmd) data considered in lectures 1 and 2 is available on the course web page under the name bone2.density.xls. Create a directory on your PC that you will use to store data and program code for this course, and copy this file to that directory. If you are a SAS user, there is also a file under the name bone2.density.sas that contains SAS code for importing an Excel file. You will have to change the name of the file in the DATAFILE= option of PROC IMPORT to the name of the Excel file on your PC. For those who wish to use S-Plus or SAS on a UNIX workstation, the data have also been stored as a text file under the name bone2.density.txt on the course web page. This file also has ten columns but the first row does not contain the variable names. The variable names you should use are id, group, bmd, weight, age, caffeine, calcium, growmilk, teenmilk, twenmilk, respectively. A description of each variable is given below in the order in which the columns appear on the data file: id group bmd An identification number for each women in the study. Indicates the exercise group and is coded as follows: 1=sedentary: no regular exercise program, 2=walker: at least 135 minutes per week, 3=aerobic dancer: at least 135 minutes per week. Bone mineral density (g/cm2) 2 weight age caffeine calcium growmilk teenmilk twenmilk Weight (kg) Age (years) Weekly caffeine consumption Weekly calcium consumption Weekly milk consumption as a child Weekly milk consumption as a teenager Weekly milk consumption between 20 and 30 years of age. Recent studies suggest that peak bone mass in women is achieved at some time between the ages of 15 and 40. After about age 45, bone loss is gradual in both males and females, but a sharp decrease in ovarian estrogen production has been identified as the cause of more rapid bone loss in women during the first ten years after menopause. Since osteoporosis is essentially irreversible, prevention is more practical than treatment. A combination of estrogen progestogen (hormone replacement therapy, or HRT) is the current treatment of choice for postmenopausal women, but HRT may be accompanied by side effects, including increased risk of cardiovascular disease, liver disease, and certain types of cancer. A second approach is to increase intake of calcium, other nutrients, and dietary fiber in developmental years in an attempt to increase peak bmd by age 45. A third approach hypothesized to increase peak bmd is the use of a reasonable amount of physical exercise. One objective of this study was to determine if physically active, non-athletic, premenopausal women engaged in regular moderate exercise achieve higher average bone mineral density than non-exercisers. A second objective was to examine effects of other factors (weight, age, caffeine intake, calcium intake, and milk consumption at various developmental levels) that might be associated with differences in bone mineral density. Use the data to answer the following questions. 1. Plot the bmd measurements against the weights of the women. Submit the graph. What does this graph suggest about the association between bmd and weight? 2. Compute the least squares estimates of the coefficients in the model bmd = β 0 + β1 weight + error . Report the values of the estimates and their standard errors. State your conclusion about the correlation between bone mineral density and weight. 3. Consider the entire set of variables in the data file. a. Report a formula for the model that you think best describes variation in bone density measurements among the women in this data set. Report estimates for all of the parameters in your model and the corresponding sums of squares. b. Report the R2 value and the AIC value for the model you presented in part (a). 3 c. Briefly summarize your conclusions about associations among the explanatory variables and associations between the non-exercise explanatory variables and bmd. d. Carefully state your conclusions about the potential benefits of a regular program of moderate exercise (dancing or walking) on increasing bmd in premenopausal women.
