Document 10699733
advertisement
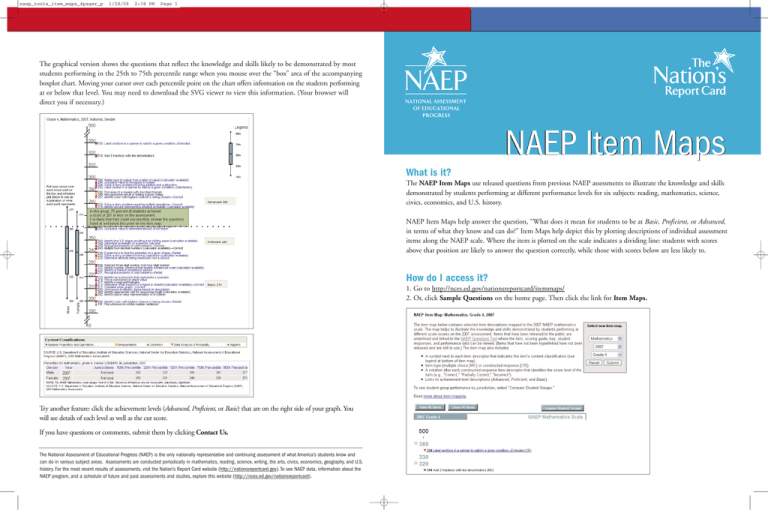
naep_tools_item_maps_4pager_p 1/28/08 2:38 PM Page 1 The graphical version shows the questions that reflect the knowledge and skills likely to be demonstrated by most students performing in the 25th to 75th percentile range when you mouse over the “box” area of the accompanying boxplot chart. Moving your cursor over each percentile point on the chart offers information on the students performing at or below that level. You may need to download the SVG viewer to view this information. (Your browser will direct you if necessary.) NAEP Item Maps What is it? The NAEP Item Maps use released questions from previous NAEP assessments to illustrate the knowledge and skills demonstrated by students performing at different performance levels for six subjects: reading, mathematics, science, civics, economics, and U.S. history. NAEP Item Maps help answer the question, “What does it mean for students to be at Basic, Proficient, or Advanced, in terms of what they know and can do?” Item Maps help depict this by plotting descriptions of individual assessment items along the NAEP scale. Where the item is plotted on the scale indicates a dividing line: students with scores above that position are likely to answer the question correctly, while those with scores below are less likely to. How do I access it? 1. Go to http://nces.ed.gov/nationsreportcard/itemmaps/ 2. Or, click Sample Questions on the home page. Then click the link for Item Maps. Try another feature: click the achievement levels (Advanced, Proficient, or Basic) that are on the right side of your graph. You will see details of each level as well as the cut score. If you have questions or comments, submit them by clicking Contact Us. The National Assessment of Educational Progress (NAEP) is the only nationally representative and continuing assessment of what America’s students know and can do in various subject areas. Assessments are conducted periodically in mathematics, reading, science, writing, the arts, civics, economics, geography, and U.S. history. For the most recent results of assessments, visit the Nation’s Report Card website (http://nationsreportcard.gov). To see NAEP data, information about the NAEP program, and a schedule of future and past assessments and studies, explore this website (http://nces.ed.gov/nationsreportcard). naep_tools_item_maps_4pager_p 1/28/08 2:38 PM Page 3 NAEP ITEM MAPS How do I use it? Simply go to the website, and in the search box on the right, select the subject, year, and grade you’d like to view. Click Submit, and the Item Map you requested will be displayed on the screen. The Item Map also provides links to released questions. Clicking on a link will take you directly to the question in the NAEP Questions Tool, where you can also view related information such as sample student responses and performance data. For example, in reading, you can view the questions as well as the passage students must read to answer each question. For more information on item mapping, click on more about item mapping. Comparing Student Groups The NAEP Item Maps have a special feature called Compare Student Groups. Using this feature, you can view performance information by different student groups, such as gender or race/ethnicity. You can also view individual, state-level results in reading, mathematics, and science. You can review the results of any one of 11 urban districts participating in NAEP’s Trial Urban District Assessment (TUDA) for those same subjects. State and TUDA results are only available for grades 4 and 8. This feature also allows you to view the scores (for a state, the nation, or one of the TUDA districts) corresponding to the 10th, 25th, 50th, 75th, and 90th percentiles. You can view these data in a table or as a graphical boxplot. The table presents only the percentiles and the scores corresponding to those percentiles. This information will appear below the Item Map.
