2014 Cohort Graduation Rate
advertisement

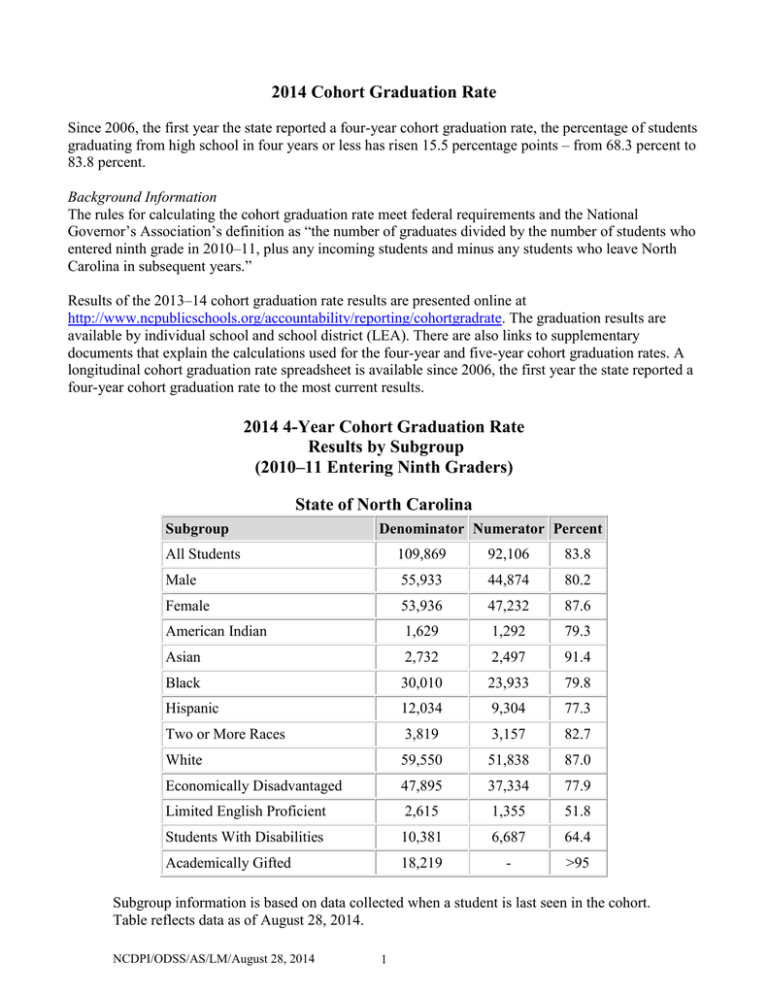
2014 Cohort Graduation Rate Since 2006, the first year the state reported a four-year cohort graduation rate, the percentage of students graduating from high school in four years or less has risen 15.5 percentage points – from 68.3 percent to 83.8 percent. Background Information The rules for calculating the cohort graduation rate meet federal requirements and the National Governor’s Association’s definition as “the number of graduates divided by the number of students who entered ninth grade in 2010–11, plus any incoming students and minus any students who leave North Carolina in subsequent years.” Results of the 2013–14 cohort graduation rate results are presented online at http://www.ncpublicschools.org/accountability/reporting/cohortgradrate. The graduation results are available by individual school and school district (LEA). There are also links to supplementary documents that explain the calculations used for the four-year and five-year cohort graduation rates. A longitudinal cohort graduation rate spreadsheet is available since 2006, the first year the state reported a four-year cohort graduation rate to the most current results. 2014 4-Year Cohort Graduation Rate Results by Subgroup (2010–11 Entering Ninth Graders) State of North Carolina Subgroup Denominator Numerator Percent All Students 109,869 92,106 83.8 Male 55,933 44,874 80.2 Female 53,936 47,232 87.6 American Indian 1,629 1,292 79.3 Asian 2,732 2,497 91.4 Black 30,010 23,933 79.8 Hispanic 12,034 9,304 77.3 Two or More Races 3,819 3,157 82.7 White 59,550 51,838 87.0 Economically Disadvantaged 47,895 37,334 77.9 Limited English Proficient 2,615 1,355 51.8 Students With Disabilities 10,381 6,687 64.4 Academically Gifted 18,219 - >95 Subgroup information is based on data collected when a student is last seen in the cohort. Table reflects data as of August 28, 2014. NCDPI/ODSS/AS/LM/August 28, 2014 1 2013 4-Year Cohort Graduation Rate Results by Subgroup (2009–10 Entering Ninth Graders) Subgroup Denominator Numerator Percent All Students 109,795 90,549 82.5 Male 56,329 44,254 78.6 Female 53,466 46,295 86.6 American Indian 1,604 1,240 77.3 Asian 2,617 2,352 89.9 Black 30,764 23,846 77.5 Hispanic 11,158 8,396 75.2 Two or More Races 3,530 2,878 81.5 White 60,031 51,760 86.2 Economically Disadvantaged 47,663 36,288 76.1 Limited English Proficient 2,813 1,374 48.8 Students With Disabilities 11,251 7,006 62.3 Academically Gifted 18,087 - >95 2014 5-Year Cohort Graduation Rate Results by Subgroup (2009–10 Entering Ninth Graders) Subgroup Denominator Numerator Percent All Students 109,795 93,208 84.9 Male 56,329 46,035 81.7 Female 53,466 47,173 88.2 American Indian 1,604 1,283 80.0 Asian 2,617 2,419 92.4 Black 30,764 24,944 81.1 Hispanic 11,158 8,867 79.5 Two or More Races 3,530 2,971 84.2 White 60,031 52,645 87.7 Economically Disadvantaged 47,663 38,040 79.8 Limited English Proficient 2,813 1,592 56.6 Students With Disabilities 11,251 7,630 67.8 Academically Gifted 18,087 - >95 Subgroup information is based on data collected when a student is last seen in the cohort. Table reflects data as of August 28, 2014. NCDPI/ODSS/AS/LM/August 28, 2014 2


