WHAT ABOUT THE 1950S? DECLINE OF THE AMERICAN FAMILY?/MEASURING AND LABELING DEVIANCE
advertisement
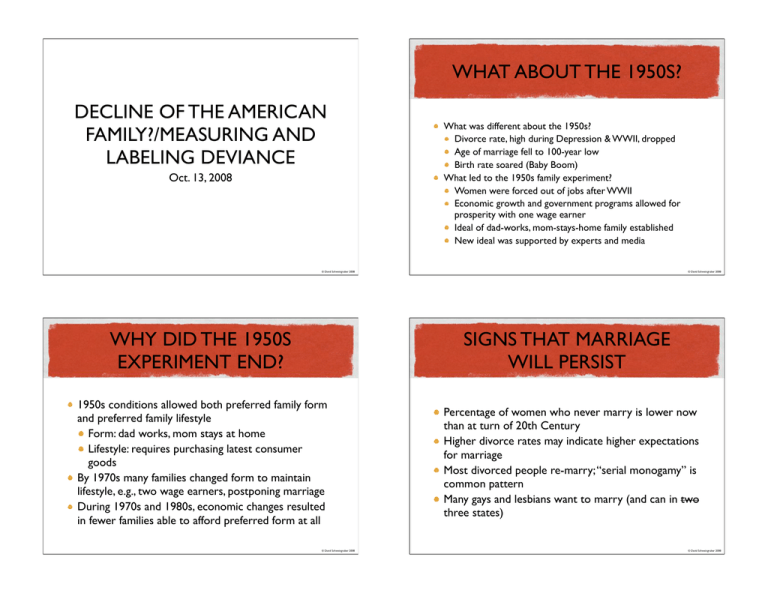
WHAT ABOUT THE 1950S? DECLINE OF THE AMERICAN FAMILY?/MEASURING AND LABELING DEVIANCE Oct. 13, 2008 What was different about the 1950s? Divorce rate, high during Depression & WWII, dropped Age of marriage fell to 100-year low Birth rate soared (Baby Boom) What led to the 1950s family experiment? Women were forced out of jobs after WWII Economic growth and government programs allowed for prosperity with one wage earner Ideal of dad-works, mom-stays-home family established New ideal was supported by experts and media © David Schweingruber 2008 WHY DID THE 1950S EXPERIMENT END? © David Schweingruber 2008 SIGNS THAT MARRIAGE WILL PERSIST 1950s conditions allowed both preferred family form and preferred family lifestyle Form: dad works, mom stays at home Lifestyle: requires purchasing latest consumer goods By 1970s many families changed form to maintain lifestyle, e.g., two wage earners, postponing marriage During 1970s and 1980s, economic changes resulted in fewer families able to afford preferred form at all © David Schweingruber 2008 Percentage of women who never marry is lower now than at turn of 20th Century Higher divorce rates may indicate higher expectations for marriage Most divorced people re-marry; “serial monogamy” is common pattern Many gays and lesbians want to marry (and can in two three states) © David Schweingruber 2008 SOCIAL CONTROL Society Social control: various means by which a society encourages conformity to its rules and expectations Social Control Individuals BART AND THE BOOT © David Schweingruber 2008 DEFINING DEVIANCE © David Schweingruber 2008 FEARING “RANDOM CRIME” Deviance: behavior, belief or condition that violates social norms By defining what is normal, society defines what is deviant (relativist approach to deviance) Origin of term is in statistics—“deviation” is the difference between the value of a given case and the group average Sociologists began using “deviance” in 1950s to encompass four major topics—crime and delinquency, mental illness, drug use/addiction, sexual misbehavior Different approaches to studying deviance: Why do people commit deviant acts? (causation approach) Why are some people labeled as deviant and what are effects of label? (labeling theory) Why do rules and punishments benefit some groups more than others? (conflict theory) Why are some forms of deviance considered problems and others are not? (social problems approach) © David Schweingruber 2008 People most fear “random crime” (Joel Best) Patternless: It can happen to anyone Increasing: Crime is getting worse Pointless: Criminal motives make no sense But none of these claims are true Crime is not random: it is stratified by gender, race, class and age Official crime has been declining over the past decade or longer (but may have risen slightly in recent years) Criminals have reasons for committing crimes © David Schweingruber 2008 60 52.3 PROPERTY CRIME RATES, 1973-2005 (NCVS) 51.2 47.7 45 42.0 30 21.0 15 0 1973 1975 1977 1979 1981 1983 1985 1987 1989 1991 1993 1995 1997 1999 2001 2003 2005 © David Schweingruber 2008 Victimization per 1,000 households Victimization per 1,000 population VIOLENT CRIME RATES, 1973-2005 (NCVS) 553.6 600 450 300 519.9 496.1 348.9 150 154.0 0 1973 1975 1977 1979 1981 1983 1985 1987 1989 1991 1993 1995 1997 1999 2001 2003 2005 © David Schweingruber 2008
