Sheet 2 Matrix Practice
advertisement
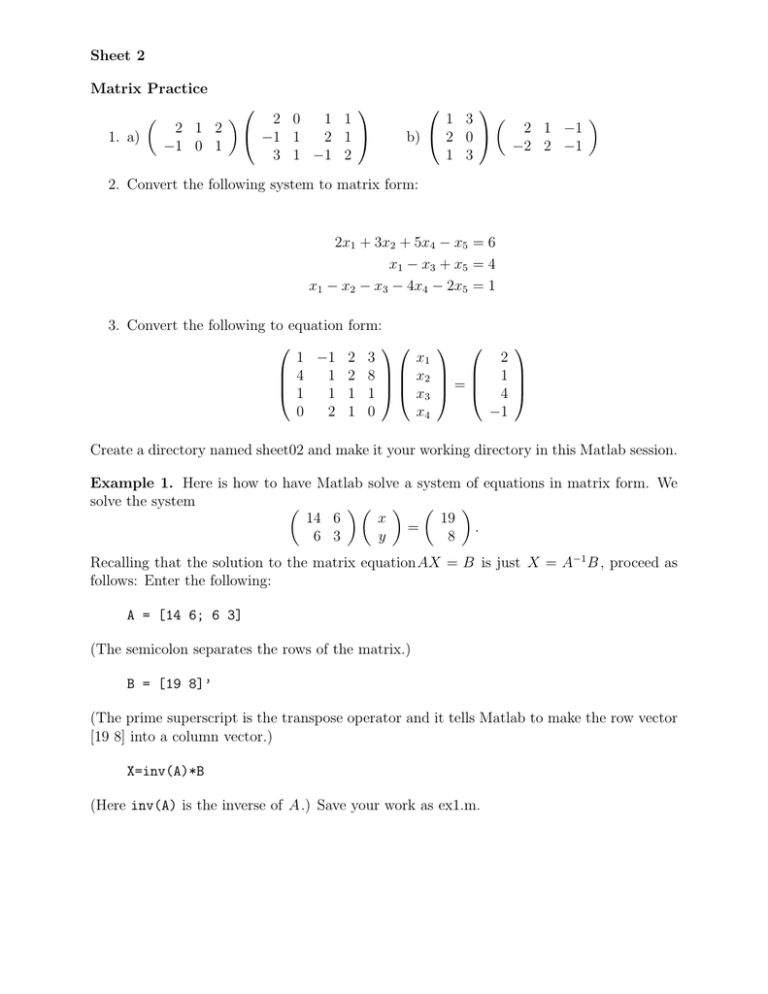
Sheet 2 Matrix Practice 1. a) 2 1 2 −1 0 1 2 0 1 1 −1 1 2 1 3 1 −1 2 1 3 2 1 −1 2 0 b) −2 2 −1 1 3 2. Convert the following system to matrix form: 2x1 + 3x2 + 5x4 − x5 = 6 x1 − x3 + x5 = 4 x1 − x2 − x3 − 4x4 − 2x5 = 1 3. Convert the following to equation 1 −1 4 1 1 1 0 2 form: 2 3 2 8 1 1 1 0 2 x1 1 x2 = x3 4 x4 −1 Create a directory named sheet02 and make it your working directory in this Matlab session. Example 1. Here is how to have Matlab solve a system of equations in matrix form. We solve the system 14 6 x 19 = . 6 3 y 8 Recalling that the solution to the matrix equationAX = B is just X = A−1 B , proceed as follows: Enter the following: A = [14 6; 6 3] (The semicolon separates the rows of the matrix.) B = [19 8]’ (The prime superscript is the transpose operator and it tells Matlab to make the row vector [19 8] into a column vector.) X=inv(A)*B (Here inv(A) is the inverse of A.) Save your work as ex1.m. Example 2. a) Use Matlab to solve the system of equations in number 3 of the matrix practice above. b) Use Matlab to check your work for number 1 of the matrix practice. Example 3. a) Find the line y = mx + b of best fit through the data points (−1, 1), (2, 3), (0, 1.75), (−2, 0.75) and (1, 2). We did all the dirty work in lecture. Recall x1 1 x2 1 V = (A0 A)−1 A0 Y where A = .. .. . . xn 1 , Y = y1 y2 .. . , and V = m b . yn Enter the x−data (remember the vectors must be column vectors): X = [ -1 2 0 -2 1 ]’ Enter the y−data: Y = [ 1 3 1.75 0.75 2 ]’ Enter A: A = [ X ones(5,1) ] Here the command ones(m,n) creates an m × n matrix with all entries being 1. Now find V : V = inv(A’*A)*A’*Y b) Plot the data and the line of best fit: x = linspace( -2.5,2.5); y = V(1,1)*x + V(2,1); plot(x,y,X’,Y’,’o’) Here we are using that V is a 2 × 1 column matrix whose entries are m and b. So for example the V(1,1) picks the entry in the first row, first column of the matrix—that is, m. The range for linspace was determined by looking at the x−coordinates of the data. The ’o’ tells Matlab to use o’s to signify the data in the plot. c) What is the least square error? The error is the length of the vector |Y − AV |. Here is how to have Matlab find the magnitude (you have to use the transpose because Matlab wants a row vector, not a column vector inside norm): error=norm((A*V-Y)’) Save your work as ex3.m. Example 4. a) In this example you are to import a huge data set of points and find the line y = mx + b of best fit. b) Plot the data and the line of best fit on the same graph. c) Find the least square error. Here is how to import the data set—you sure don’t want to enter it by hand: Go to my homepage and hit the Pre-REU link. Download the file line-data-s2.csv to the directory in which you are currently working. The data set is a matrix whose first row consists of the x−coordinates and the second row consists of the corresponding y−values. Save a new sheet as ex4.m and enter the following lines: data = load(’line-data-s2.csv’); X = data(1,:)’; Y = data(2,:)’ The load command saves the data set in the matrix data. The (m,:) tells Matlab to extract the mth row of the matrix. The transpose is to make column vectors for the least squares solution. In order to mimic what was done in the previous example, you need to know how many entries are in X so that you can define A and you need to know the largest and smallest entries in X so you can make the appropriate linspace command. Here is how to do this: first execute the file to load the data. Then in the command window, enter length(X). This tells you how many entries are in X. To find the biggest and smallest entries in X, enter max(X) then min(X). Now you are ready to solve the problem. Save your work. Example 5. a) Consider the data set (1, 1), (2, 2.5), (1.5, −1) and (4, 50). The data does not really fit a straight line. Your task is the find the parabola y = ax2 + bx + c of best fit in the least squares sense. Express the problem as a least squares problem: Choose V to minimize the length of Y − AV —that is, AV is closest to Y . Model on the line of best fit example in lecture to identify A and Y . Once you do this, you can apply the general least squares problem solution V = (A0 A)−1 A0 Y Solve the problem, plot the data and the parabola of best fit on the same graph and find the least square error. Can you guess what A and Y should be for larger data sets? b) Do a line of best fit for the data and compute the least squares error. Which gives a better fit, the line or the parabola? Example 6. Import the large data set parab-data-s2.csv and find the parabola of best fit. Plot data and parabola on the same graph and find the least square error.
