Two-Color Microarray Experimental Design Notation Simple Examples of Analysis for a Single Gene
advertisement
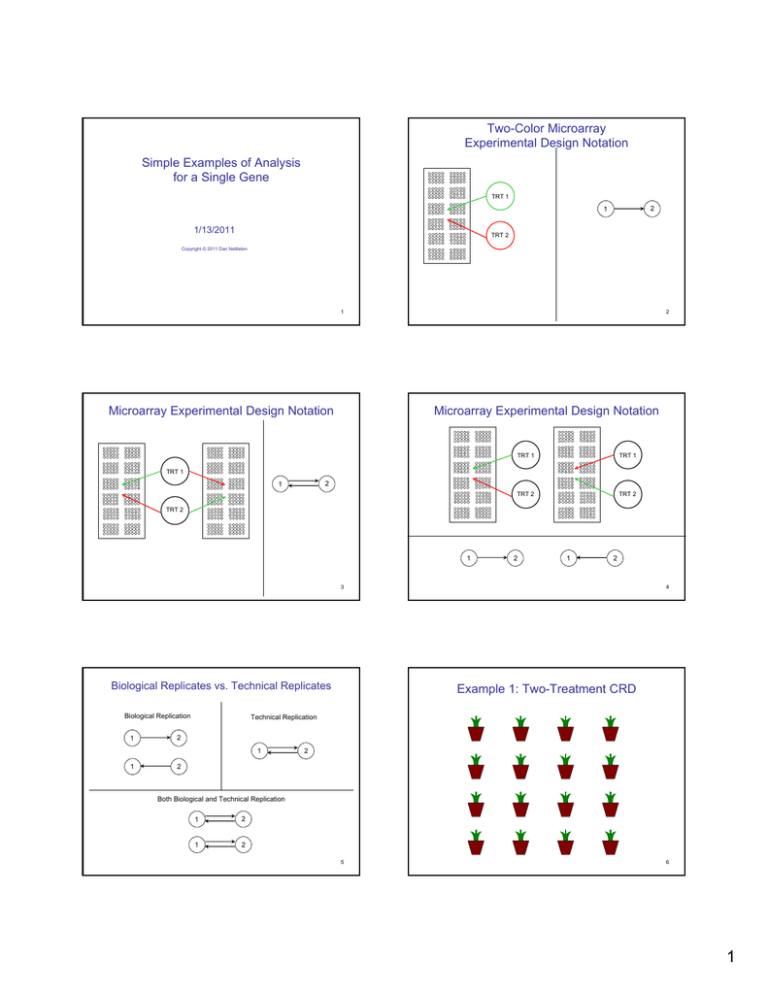
Two-Color Microarray
Experimental Design Notation
Simple Examples of Analysis
for a Single Gene
TRT 1
2
1
1/13/2011
TRT 2
Copyright © 2011 Dan Nettleton
1
Microarray Experimental Design Notation
2
Microarray Experimental Design Notation
TRT 1
TRT 1
TRT 2
TRT 2
TRT 1
2
1
TRT 2
1
2
1
2
3
Biological Replicates vs. Technical Replicates
Biological Replication
1
2
1
2
4
Example 1: Two-Treatment CRD
Technical Replication
1
2
Both Biological and Technical Replication
1
2
1
2
5
6
1
Randomly Pair Plants Receiving
Different Treatments
Assign 8 Plants to Each Treatment Completely at Random
2
2
2
1
1
2
1
2
2
1
1
2
1
2
1
2
1
1
2
1
1
2
1
2
1
2
1
2
1
2
1
2
7
Randomly Assign Pairs to Slides
Balancing the Two Dye Configurations
8
Observed Normalized Log Signal Intensities
for One Gene
1
2
1
2
Y111
Y221
Y125
Y215
1
2
1
2
Y112
Y222
Y126
Y216
1
2
1
2
Y113
Y223
Y127
Y217
1
2
1
2
Y114
Y224
Y128
Y218
treatment
dye
slide
9
10
Unknown Means Underlying the Observed
Normalized Log Signal Intensities (NLSI)
Differential Expression
μ+τ1+δ1
μ+τ2+δ2
μ+τ1+δ2
μ+τ2+δ1
μ+τ1+δ1
μ+τ2+δ2
μ+τ1+δ2
μ+τ2+δ1
μ+τ1+δ1
μ+τ2+δ2
μ+τ1+δ2
μ+τ2+δ1
μ+τ1+δ1
μ+τ2+δ2
μ+τ1+δ2
μ+τ2+δ1
μ+τ1+δ1
μ+τ2+δ2
μ+τ1+δ2
μ+τ2+δ1
μ+τ1+δ1
μ+τ2+δ2
μ+τ1+δ2
μ+τ2+δ1
μ+τ1+δ1
μ+τ2+δ2
μ+τ1+δ2
μ+τ2+δ1
μ+τ1+δ1
μ+τ2+δ2
μ+τ1+δ2
μ+τ2+δ1
μ is a real-valued parameter common to all observations.
A gene is said to be differentially expressed if τ1 ≠ τ2.
τ1 and τ2 represent the effects of treatments 1 and 2 on mean NLSI.
δ1 and δ2 represents the effects of Cy3 and Cy5 dyes on mean NLSI.
11
12
2
Unknown Random Effects Underlying
Observed NLSI
s1+e111
s1+e221
s5+e125
s5+e215
s2+e112
s2+e222
s6+e126
s6+e216
s3+e113
s3+e223
s7+e127
s7+e217
s4+e114
s4+e224
s8+e128
s8+e218
To make our model complete, we need to
say more about the random effects.
• We will almost always assume that random
effects are independent and normally distributed
with mean zero and a factor-specific variance.
• s1, s2, ..., s8 iid
~ N(0,σs2) and independent of
e111, e112, e113, e114, e221, e222, e223, e224, e125,
iid
e126, e127, e128, e215, e216, e217, e218 ~ N(0,σe2 ).
s1, s2, s3, s4, s5, s6, s7, and s8 represent slide effects.
e111,...,e218 represent error random effects that include any
sources of variation unaccounted for by other terms.
iid
13
(or just eijk ~ N(0,σe2) to save time and space.)
14
Observed NLSI are Modeled as
Means Plus Random Effects
What does s1, s2, ..., s8 iid
~ N(0,σs2) mean?
Y111=μ+τ1+δ1
+s1+e111
Y221=μ+τ2+δ2
+s1+e221
Y125=μ+τ1+δ2
+s5+e125
Y215=μ+τ2+δ1
+s5+e215
Y112=μ+τ1+δ1
+s2+e112
Y222=μ+τ2+δ2
+s2+e222
Y126=μ+τ1+δ2
+s6+e126
Y216=μ+τ2+δ1
+s6+e216
Y113=μ+τ1+δ1
+s3+e113
Y223=μ+τ2+δ2
+s3+e223
Y127=μ+τ1+δ2
+s7+e127
Y217=μ+τ2+δ1
+s7+e217
Y114=μ+τ1+δ1
+s4+e114
Y224=μ+τ2+δ2
+s4+e224
Y128=μ+τ1+δ2
+s8+e128
Y218=μ+τ2+δ1
+s8+e218
Yijk=μ+τi+δj+sk+eijk
15
Observed Normalized Signal Intensities
(NLSI) for One Gene
5.72
4.86
6.02
4.26
7.08
5.20
7.11
5.25
4.87
3.20
6.62
5.50
8.03
6.72
8.50
6.85
Given data, our task it to determine whether the gene
is differentially expressed and, if so, estimate the
magnitude and direction of differential expression.
17
16
Analysis of Log Red to Green Ratios
• Rather than working with the normalized log
signal intensities, it is often customary to
consider the log of the red to green normalized
signals from each slide as the basic data for
analysis.
• This is equivalent to working with the
red – green difference in NLSI from each slide.
log(R/G)=log(R)-log(G)
18
3
Differences for Slides with Treatment 1 Green
and Treatment 2 Red
Slide
Differences for Slides with Treatment 1 Red
and Treatment 2 Green
Difference
Difference
Y111=μ+τ1+δ1
+s1+e111
Y221=μ+τ2+δ2
+s1+e221
Y221-Y111= τ2-τ1+δ2-δ1+e221-e111
Y112=μ+τ1+δ1
+s2+e112
Y222=μ+τ2+δ2
+s2+e222
Y113=μ+τ1+δ1
+s3+e113
Y114=μ+τ1+δ1
+s4+e114
Slide
Y125-Y215= τ1-τ2+δ2-δ1+e125-e215
Y125=μ+τ1+δ2
+s5+e125
Y215=μ+τ2+δ1
+s5+e215
Y222-Y112= τ2-τ1+δ2-δ1+e222-e112
Y126-Y216= τ1-τ2+δ2-δ1+e126-e216
Y126=μ+τ1+δ2
+s6+e126
Y216=μ+τ2+δ1
+s6+e216
Y223=μ+τ2+δ2
+s3+e223
Y223-Y113= τ2-τ1+δ2-δ1+e223-e113
Y127-Y217= τ1-τ2+δ2-δ1+e127-e217
Y127=μ+τ1+δ2
+s7+e127
Y217=μ+τ2+δ1
+s7+e217
Y224=μ+τ2+δ2
+s4+e224
Y224-Y114= τ2-τ1+δ2-δ1+e224-e114
Y128-Y218= τ1-τ2+δ2-δ1+e128-e218
Y128=μ+τ1+δ2
+s8+e128
Y218=μ+τ2+δ1
+s8+e218
Note that according to our original model, these differences
are iid N(τ2-τ1+δ2-δ1, 2σe2).
Note that according to our original model, these differences
are iid N(τ1-τ2+δ2-δ1, 2σe2).
19
If we let dk denote the difference from slide k,
we have
20
Estimation of the Direction and Magnitude
of Differential Expression
d1, d2, d3, d4 iid N(τ2-τ1+δ2-δ1, 2σe2)
• An unbiased estimator of τ1-τ2 is given by
independent of
{ mean(d5, d6, d7, d8) - mean(d1, d2, d3, d4) } / 2.
d5, d6, d7, d8 iid N(τ1-τ2+δ2-δ1, 2σe2).
• Because τ1-τ2 is a difference in treatment effects for a
measure of log expression level, exp(τ1-τ2) can be
interpreted as a ratio of expression levels on the original
scale.
A standard two-sample t-test can be used to test
H0 : τ2-τ1+δ2-δ1= τ1-τ2+δ2-δ1 which is equivalent to
• exp[ { mean(d5, d6, d7, d8) - mean(d1, d2, d3, d4) } / 2 ] can
be reported as an estimate of the fold change in the
expression level for treatment 1 relative to treatment 2.
H0 : τ1= τ2 (null hypothesis of no differential expression).
21
Observed Normalized Log Signal Intensities
(NLSI) for One Gene
5.72
4.86
6.02
4.26
7.08
5.20
7.11
5.25
4.87
3.20
6.62
5.50
8.03
6.72
8.50
6.85
22
P-Value for Testing τ1 = τ2 is < 0.0001 Estimated Fold Change=4.54
95% Confidence Interval for Fold Change 3.23 to 6.38
23
24
4
Example 2: CRD with Affymetrix Technology
P-Value for Testing τ1 = τ2 is 0.0660 Estimated Fold Change=7.76
95% Confidence Interval for Fold Change 0.83 to 72.49
• What genes are involved in muscle hypertrophy?
• Design a treatment that will induce hypertrophy in
muscle tissue and an appropriate control treatment.
• Randomly assign experimental units to the two
treatments.
• Use microarray technology to measure mRNA transcript
abundance in muscle tissue.
• Identify genes whose mRNA levels differs between
treatments.
25
26
Assign 6 mice to each treatment
completely at random
Assign 6 mice to each group
completely at random
T
T
C
C
C
T
C
T
C
T
C
T
27
28
Measure Expression in Relevant Muscle Tissue with
Affymetrix GeneChips
Normalized Log Scale Data
Experimental Units
T
C
C
T
T
C
T
C
C
T
C
Genes
T1
T2
T3
T4
T5
T6
C1
C2
C3
C4
C5
C6
1
3.7
4.1
3.9
5.1
5.4
5.0
6.0
5.5
4.0
4.6
4.6
5.3
2
8.2
6.2
7.3
7.6
6.0
6.7
8.1
6.4
5.6
7.6
6.6
8.4
3
6.9
4.1
5.1
3.3
5.4
6.6
6.0
4.9
5.7
9.3
7.4
9.1
4
.
.
.
8.6
.
.
.
8.8
.
.
.
9.1
.
.
.
9.8
.
.
.
7.9
.
.
.
7.4
.
.
.
6.2
.
.
.
6.8
.
.
.
6.6
.
.
.
6.8
.
.
.
5.5
.
.
.
7.7
.
.
.
40000
3.5
1.5
2.9
4.5
0.9
0.9
3.0
3.9
3.8
3.1
3.9
1.3
T
29
30
5
Model for One Gene
Gene 4: Data Analysis
Yij=μ+τi+eij (i=1,2; j=1, 2, 3, 4, 5, 6)
Y11=8.6
Y21=6.2
Yij=normalized log signal intensity for the jth
experimental unit exposed to the ith treatment
Y12=8.8
Y22=6.8
Y13=9.1
Y23=6.6
Y14=9.8
Y24=6.8
Y15=7.9
Y25=5.5
Y16=7.4
Y26=7.7
Y1.=8.6
Y2.=6.6
μ=real-valued parameter common to all obs.
τi=effect due to ith treatment
Y1.-Y2.=τ1-τ2+e1.-e2.=2.0
se( Y1. - Y2.) = sp
1 1
+
n1 n2
= 0.7949843
= 0.4589844
eij=error effect for the jth experimental unit exposed
to ith treatment
31
Gene 4: 95% Confidence Interval for τ1-τ2
Y1. - Y2. = 2.0
1 1
+
6 6
32
Gene 4: 95% Confidence Interval for Fold Change
se( Y1. - Y2.) = 0.4589844
Y .- Y .
Estimated Fold Change= e 1 2 = e 2.0 ≈7.4
)
Y1. - Y2. ± t (n01.+975
n2 - 2se( Y1. - Y2.)
(e
2.0 ± 2.228 * 0.4589844
(0.98, 3.02)
( 0.975 )
Y1.- Y2.- tn1 +n2 - 2se ( Y1.- Y2.)
,e
( 0.975 )
Y1.- Y2.+ tn1 +n2 - 2se ( Y1.- Y2.)
)
(2.7,20.5)
33
34
Gene 4: t-test
Y11=8.6
Y21=6.2
Y12=8.8
Y22=6.8
Y13=9.1
Y23=6.6
Y14=9.8
Y24=6.8
Y1.-Y2.=τ1-τ2+e1.-e2.=2.0
t=
Y1. - Y2.
2.0
=
= 4.3574.
se(Y1. - Y2.) 0.4589844
Y15=7.9
Y25=5.5
Compare to a t-distribution
Y16=7.4
Y26=7.7
with n1+n2-2=10 d.f. to
Y1.=8.6
Y2.=6.6
obtain p-value≈0.001427.
35
6
