Stat 401 A XM Homework 7 On-Campus Due Date: Off-Campus Due Date:
advertisement
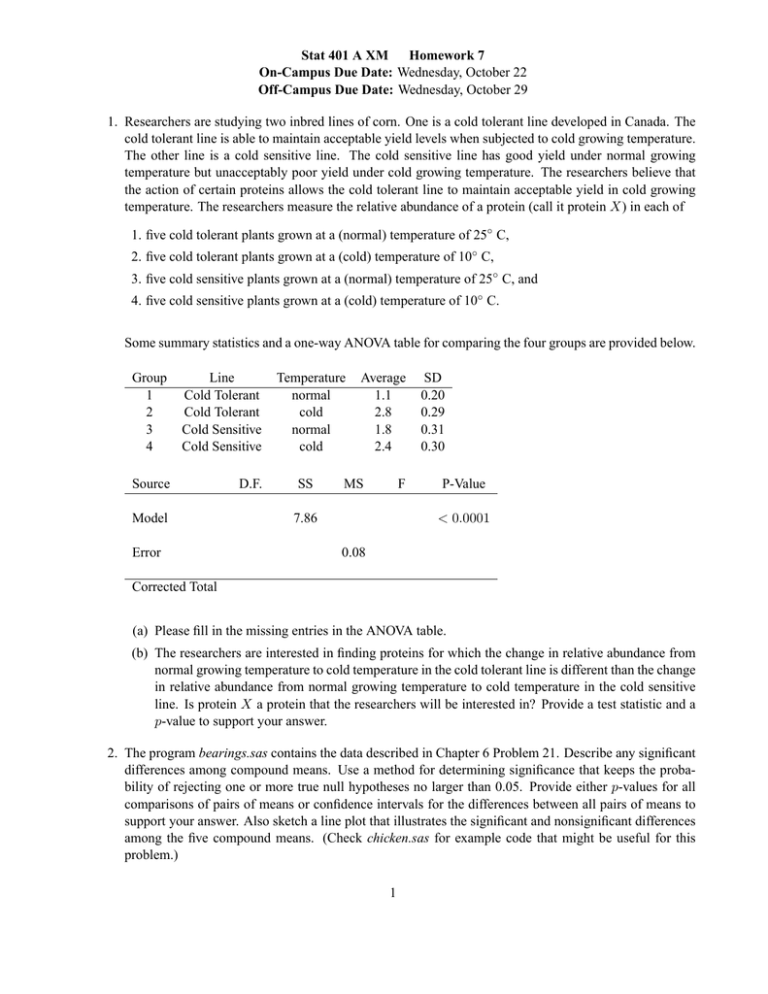
Stat 401 A XM Homework 7 On-Campus Due Date: Wednesday, October 22 Off-Campus Due Date: Wednesday, October 29 1. Researchers are studying two inbred lines of corn. One is a cold tolerant line developed in Canada. The cold tolerant line is able to maintain acceptable yield levels when subjected to cold growing temperature. The other line is a cold sensitive line. The cold sensitive line has good yield under normal growing temperature but unacceptably poor yield under cold growing temperature. The researchers believe that the action of certain proteins allows the cold tolerant line to maintain acceptable yield in cold growing temperature. The researchers measure the relative abundance of a protein (call it protein X) in each of 1. five cold tolerant plants grown at a (normal) temperature of 25◦ C, 2. five cold tolerant plants grown at a (cold) temperature of 10◦ C, 3. five cold sensitive plants grown at a (normal) temperature of 25◦ C, and 4. five cold sensitive plants grown at a (cold) temperature of 10◦ C. Some summary statistics and a one-way ANOVA table for comparing the four groups are provided below. Group 1 2 3 4 Line Cold Tolerant Cold Tolerant Cold Sensitive Cold Sensitive Source D.F. Model Error Temperature normal cold normal cold SS Average 1.1 2.8 1.8 2.4 MS F SD 0.20 0.29 0.31 0.30 P-Value < 0.0001 7.86 0.08 Corrected Total (a) Please fill in the missing entries in the ANOVA table. (b) The researchers are interested in finding proteins for which the change in relative abundance from normal growing temperature to cold temperature in the cold tolerant line is different than the change in relative abundance from normal growing temperature to cold temperature in the cold sensitive line. Is protein X a protein that the researchers will be interested in? Provide a test statistic and a p-value to support your answer. 2. The program bearings.sas contains the data described in Chapter 6 Problem 21. Describe any significant differences among compound means. Use a method for determining significance that keeps the probability of rejecting one or more true null hypotheses no larger than 0.05. Provide either p-values for all comparisons of pairs of means or confidence intervals for the differences between all pairs of means to support your answer. Also sketch a line plot that illustrates the significant and nonsignificant differences among the five compound means. (Check chicken.sas for example code that might be useful for this problem.) 1 3. Examine a residual plot and a boxplot, histogram, and normal probability plot of the residuals from the bearing analysis conducted in problem 1. (See crab.sas for examples of the code needed to produce such plots.) (a) Do any of these plots indicate any problems with the assumptions of the analysis that you did in problem 2? Explain. (b) There is no need to change your answer to problem 2 or to do any further analysis of the bearing data for the purposes of this homework assignment. However, please explain what you would do next if you were in charge of analyzing the bearing data. 2


