Research Administration Annual Report Agency Fiscal years 2010 and 2011 2010-
advertisement
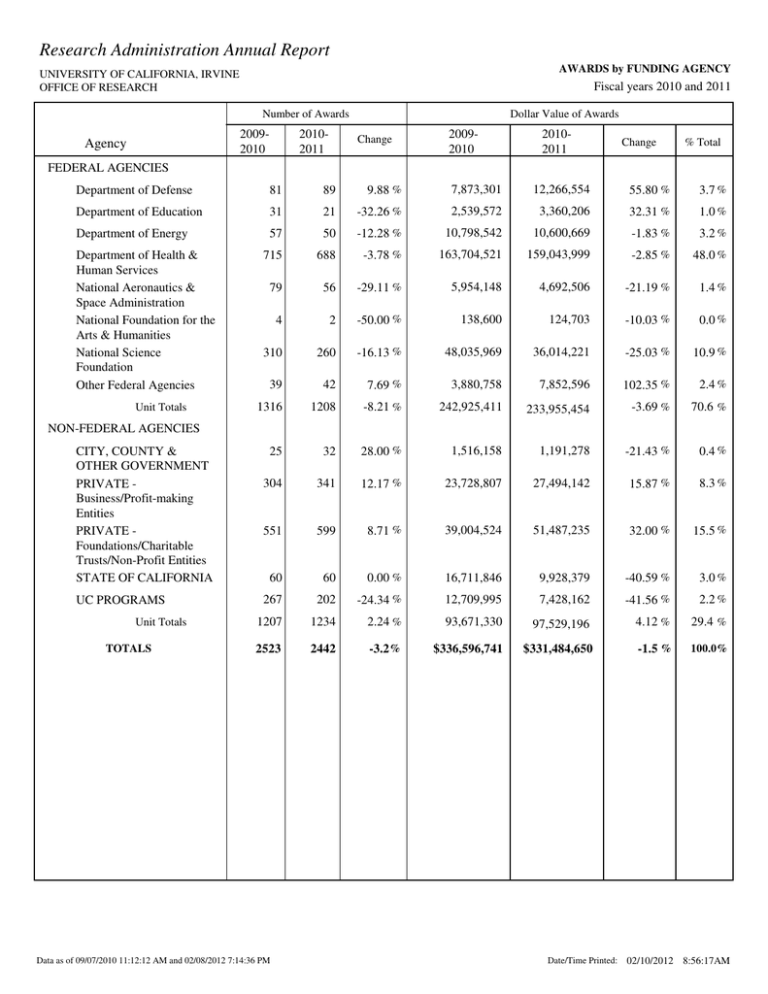
Research Administration Annual Report AWARDS by FUNDING AGENCY UNIVERSITY OF CALIFORNIA, IRVINE OFFICE OF RESEARCH Fiscal years 2010 and 2011 Number of Awards 20092010 Agency 20102011 Dollar Value of Awards Change 20092010 20102011 Change % Total FEDERAL AGENCIES Department of Defense 81 89 9.88 % 7,873,301 12,266,554 55.80 % 3.7 % Department of Education 31 21 -32.26 % 2,539,572 3,360,206 32.31 % 1.0 % Department of Energy 57 50 -12.28 % 10,798,542 10,600,669 -1.83 % 3.2 % 715 688 -3.78 % 163,704,521 159,043,999 -2.85 % 48.0 % 79 56 -29.11 % 5,954,148 4,692,506 -21.19 % 1.4 % 4 2 -50.00 % 138,600 124,703 -10.03 % 0.0 % 310 260 -16.13 % 48,035,969 36,014,221 -25.03 % 10.9 % 39 42 7.69 % 3,880,758 7,852,596 102.35 % 2.4 % 1316 1208 -8.21 % 242,925,411 233,955,454 -3.69 % 70.6 % 25 32 28.00 % 1,516,158 1,191,278 -21.43 % 0.4 % 304 341 12.17 % 23,728,807 27,494,142 15.87 % 8.3 % 551 599 8.71 % 39,004,524 51,487,235 32.00 % 15.5 % 60 60 0.00 % 16,711,846 9,928,379 -40.59 % 3.0 % 267 202 -24.34 % 12,709,995 7,428,162 -41.56 % 2.2 % 1207 1234 2.24 % 93,671,330 97,529,196 4.12 % 29.4 % 2523 2442 -3.2 % $336,596,741 $331,484,650 -1.5 % 100.0% Department of Health & Human Services National Aeronautics & Space Administration National Foundation for the Arts & Humanities National Science Foundation Other Federal Agencies Unit Totals NON-FEDERAL AGENCIES CITY, COUNTY & OTHER GOVERNMENT PRIVATE Business/Profit-making Entities PRIVATE Foundations/Charitable Trusts/Non-Profit Entities STATE OF CALIFORNIA UC PROGRAMS Unit Totals TOTALS Data as of 09/07/2010 11:12:12 AM and 02/08/2012 7:14:36 PM Date/Time Printed: 02/10/2012 8:56:17AM
