Wind Speed Variability and Adaptation Strategies in Bradford Griffin , Karen Kohfeld
advertisement
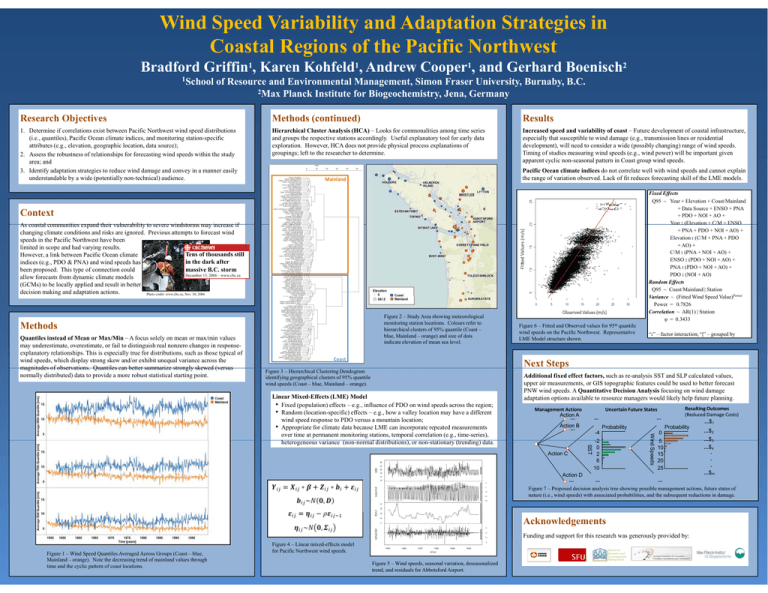
Wind Speed Variability and Adaptation Strategies in Coastal Regions of the Pacific Northwest Bradford Griffin1, Karen Kohfeld1, Andrew Cooper1, and Gerhard Boenisch2 1School of Resource and Environmental Management Management, Simon Fraser University, University Burnaby, Burnaby B.C. BC 2Max Planck Institute for Biogeochemistry, Jena, Germany Research Objectives Methods (continued) Results 1. Determine if correlations exist between Pacific Northwest wind speed distributions (i.e., quantiles), Pacific Ocean climate indices, and monitoring station-specific attributes (e.g., elevation, geographic location, data source); 2 Assess 2. A the h robustness b off relationships l i hi for f forecasting f i wind i d speeds d within i hi the h study d area; and 3. Identify adaptation strategies to reduce wind damage and convey in a manner easily understandable by a wide (potentially non-technical) audience. Hierarchical Cluster Analysis (HCA) – Looks for commonalities among time series and groups the respective stations accordingly. Useful explanatory tool for early data exploration. However, HCA does not provide physical process explanations of groupings; left to the researcher to determine determine. Increased speed and variability of coast – Future development of coastal infrastructure, especially that susceptible to wind damage (e.g., transmission lines or residential development), will need to consider a wide (possibly changing) range of wind speeds. Timing of studies measuring wind speeds (e.g., (e g wind power) will be important given apparent cyclic non-seasonal pattern in Coast group wind speeds. Pacific Ocean climate indices do not correlate well with wind speeds and cannot explain the range of variation observed. Lack of fit reduces forecasting skill of the LME models. Mainland Fixed Effects Q95 ~ Year + Elevation + Coast/Mainland + Data Source + ENSO + PNA + PDO + NOI + AO + Year : (Elevation + C/M + ENSO + PNA + PDO + NOI + AO) + Elevation : (C/M + PNA + PDO + AO) + C/M : (PNA + NOI + AO) + ENSO : (PDO + NOI + AO) + PNA : (PDO + NOI + AO) + PDO : (NOI + AO) Random Effects Q95 ~ Coast/Mainland | Station Variance ~ (Fitted Wind Speed Value)Power Power = 0.7826 Correlation ~ AR(1) | Station φ = 0.3433 Context As coastal communities expand their vulnerability to severe windstorms may increase if changing climate conditions and risks are ignored. Previous attempts to forecast wind speeds in the Pacific Northwest have been limited in scope and had varying results. Tens of thousands still However, a link between Pacific Ocean climate in the dark after indices (e.g., PDO & PNA) and wind speeds has massive B.C. storm been proposed. This type of connection could December 15, 2006 – www.cbc.ca allow forecasts from dynamic climate models (GCMs) to be locally applied and result in better decision making and adaptation actions. Photo credit: www.cbc.ca, Nov. 30, 2006 Figure 2 – Study Area showing meteorological monitoring station locations. Colours refer to hierarchical clusters of 95% quantile (Coast – blue, Mainland – orange) and size of dots indicate elevation of mean sea level. Methods Quantiles instead of Mean or Max/Min – A focus solely on mean or max/min values may underestimate, overestimate, or fail to distinguish real nonzero changes in responseexplanatory relationships. This is especially true for distributions, such as those typical of wind speeds, which display strong skew and/or exhibit unequal variance across the magnitudes of observations observations. Quantiles can better summarize strongly skewed (versus normally distributed) data to provide a more robust statistical starting point. Coast Figure 6 – Fitted and Observed values for 95th quantile wind speeds on the Pacific Northwest. Representative LME Model structure shown. “:” – factor interaction; “|” – grouped by Next Steps p Figure 3 – Hierarchical Clustering Dendogram identifying geographical clusters of 95% quantile wind speeds (Coast – blue, Mainland – orange). Management Actions Action A ... Action ... B Action D ... Resulting Outcomes (Reduced Damage Costs) ...$1 Probability ...$2 0 ...$3 5 ...$4 10 . 15 . 20 . 25 ...$m ... Uncertain Future States ... Probability -4 -2 2 0 2 6 10 Wind Speeds Action C ... SST Linear Mixed-Effects (LME) Model • Fixed (population) effects – e.g., influence of PDO on wind speeds across the region; • Random (location-specific) effects – e.g., how a valley location may have a different wind speed response to PDO versus a mountain location; • Appropriate for climate data because LME can incorporate repeated measurements over time at permanent monitoring stations, temporal correlation (e.g., time-series), h heterogeneous variance i (non-normal ( l distributions), di ib i ) or non-stationary i (trending) ( di ) data. d Additional fixed effect factors, such as re-analysis SST and SLP calculated values, upper air measurements, or GIS topographic features could be used to better forecast PNW wind speeds. A Quantitative Decision Analysis focusing on wind damage adaptation options available to resource managers would likely help future planning. ... Figure 7 – Proposed decision analysis tree showing possible management actions, future states of nature (i.e., wind speeds) with associated probabilities, and the subsequent reductions in damage. Acknowledgements Funding and support for this research was generously provided by: Figure 1 – Wind Speed Quantiles Averaged Across Groups (Coast – blue, Mainland – orange). Note the decreasing trend of mainland values through time and the cyclic pattern of coast locations. Figure 4 – Linear mixed-effects model for Pacific Northwest wind speeds. Figure 5 – Wind speeds, seasonal variation, deseasonalized trend, and residuals for Abbotsford Airport. School of Resource and Environmental Management
