Standard Space and Individually-Derived Regions of Interest: An Experimental Comparison
advertisement

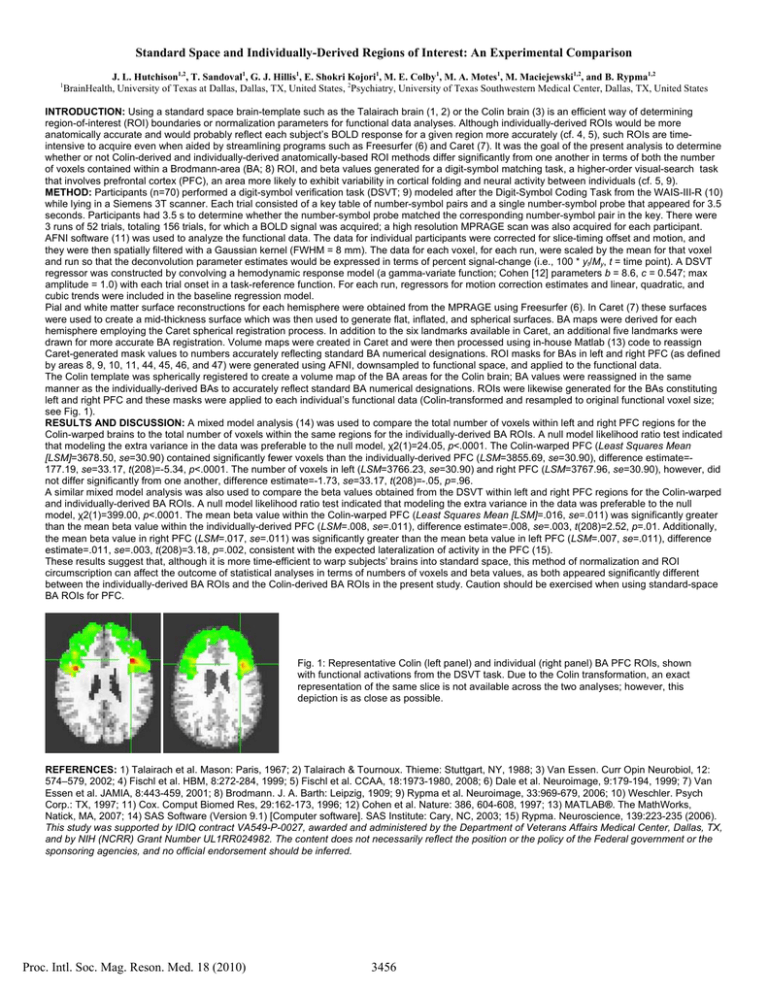
Standard Space and Individually-Derived Regions of Interest: An Experimental Comparison 1 J. L. Hutchison1,2, T. Sandoval1, G. J. Hillis1, E. Shokri Kojori1, M. E. Colby1, M. A. Motes1, M. Maciejewski1,2, and B. Rypma1,2 BrainHealth, University of Texas at Dallas, Dallas, TX, United States, 2Psychiatry, University of Texas Southwestern Medical Center, Dallas, TX, United States INTRODUCTION: Using a standard space brain-template such as the Talairach brain (1, 2) or the Colin brain (3) is an efficient way of determining region-of-interest (ROI) boundaries or normalization parameters for functional data analyses. Although individually-derived ROIs would be more anatomically accurate and would probably reflect each subject’s BOLD response for a given region more accurately (cf. 4, 5), such ROIs are timeintensive to acquire even when aided by streamlining programs such as Freesurfer (6) and Caret (7). It was the goal of the present analysis to determine whether or not Colin-derived and individually-derived anatomically-based ROI methods differ significantly from one another in terms of both the number of voxels contained within a Brodmann-area (BA; 8) ROI, and beta values generated for a digit-symbol matching task, a higher-order visual-search task that involves prefrontal cortex (PFC), an area more likely to exhibit variability in cortical folding and neural activity between individuals (cf. 5, 9). METHOD: Participants (n=70) performed a digit-symbol verification task (DSVT; 9) modeled after the Digit-Symbol Coding Task from the WAIS-III-R (10) while lying in a Siemens 3T scanner. Each trial consisted of a key table of number-symbol pairs and a single number-symbol probe that appeared for 3.5 seconds. Participants had 3.5 s to determine whether the number-symbol probe matched the corresponding number-symbol pair in the key. There were 3 runs of 52 trials, totaling 156 trials, for which a BOLD signal was acquired; a high resolution MPRAGE scan was also acquired for each participant. AFNI software (11) was used to analyze the functional data. The data for individual participants were corrected for slice-timing offset and motion, and they were then spatially filtered with a Gaussian kernel (FWHM = 8 mm). The data for each voxel, for each run, were scaled by the mean for that voxel and run so that the deconvolution parameter estimates would be expressed in terms of percent signal-change (i.e., 100 * yt/My, t = time point). A DSVT regressor was constructed by convolving a hemodynamic response model (a gamma-variate function; Cohen [12] parameters b = 8.6, c = 0.547; max amplitude = 1.0) with each trial onset in a task-reference function. For each run, regressors for motion correction estimates and linear, quadratic, and cubic trends were included in the baseline regression model. Pial and white matter surface reconstructions for each hemisphere were obtained from the MPRAGE using Freesurfer (6). In Caret (7) these surfaces were used to create a mid-thickness surface which was then used to generate flat, inflated, and spherical surfaces. BA maps were derived for each hemisphere employing the Caret spherical registration process. In addition to the six landmarks available in Caret, an additional five landmarks were drawn for more accurate BA registration. Volume maps were created in Caret and were then processed using in-house Matlab (13) code to reassign Caret-generated mask values to numbers accurately reflecting standard BA numerical designations. ROI masks for BAs in left and right PFC (as defined by areas 8, 9, 10, 11, 44, 45, 46, and 47) were generated using AFNI, downsampled to functional space, and applied to the functional data. The Colin template was spherically registered to create a volume map of the BA areas for the Colin brain; BA values were reassigned in the same manner as the individually-derived BAs to accurately reflect standard BA numerical designations. ROIs were likewise generated for the BAs constituting left and right PFC and these masks were applied to each individual’s functional data (Colin-transformed and resampled to original functional voxel size; see Fig. 1). RESULTS AND DISCUSSION: A mixed model analysis (14) was used to compare the total number of voxels within left and right PFC regions for the Colin-warped brains to the total number of voxels within the same regions for the individually-derived BA ROIs. A null model likelihood ratio test indicated that modeling the extra variance in the data was preferable to the null model, χ2(1)=24.05, p<.0001. The Colin-warped PFC (Least Squares Mean [LSM]=3678.50, se=30.90) contained significantly fewer voxels than the individually-derived PFC (LSM=3855.69, se=30.90), difference estimate=177.19, se=33.17, t(208)=-5.34, p<.0001. The number of voxels in left (LSM=3766.23, se=30.90) and right PFC (LSM=3767.96, se=30.90), however, did not differ significantly from one another, difference estimate=-1.73, se=33.17, t(208)=-.05, p=.96. A similar mixed model analysis was also used to compare the beta values obtained from the DSVT within left and right PFC regions for the Colin-warped and individually-derived BA ROIs. A null model likelihood ratio test indicated that modeling the extra variance in the data was preferable to the null model, χ2(1)=399.00, p<.0001. The mean beta value within the Colin-warped PFC (Least Squares Mean [LSM]=.016, se=.011) was significantly greater than the mean beta value within the individually-derived PFC (LSM=.008, se=.011), difference estimate=.008, se=.003, t(208)=2.52, p=.01. Additionally, the mean beta value in right PFC (LSM=.017, se=.011) was significantly greater than the mean beta value in left PFC (LSM=.007, se=.011), difference estimate=.011, se=.003, t(208)=3.18, p=.002, consistent with the expected lateralization of activity in the PFC (15). These results suggest that, although it is more time-efficient to warp subjects’ brains into standard space, this method of normalization and ROI circumscription can affect the outcome of statistical analyses in terms of numbers of voxels and beta values, as both appeared significantly different between the individually-derived BA ROIs and the Colin-derived BA ROIs in the present study. Caution should be exercised when using standard-space BA ROIs for PFC. Fig. 1: Representative Colin (left panel) and individual (right panel) BA PFC ROIs, shown with functional activations from the DSVT task. Due to the Colin transformation, an exact representation of the same slice is not available across the two analyses; however, this depiction is as close as possible. REFERENCES: 1) Talairach et al. Mason: Paris, 1967; 2) Talairach & Tournoux. Thieme: Stuttgart, NY, 1988; 3) Van Essen. Curr Opin Neurobiol, 12: 574–579, 2002; 4) Fischl et al. HBM, 8:272-284, 1999; 5) Fischl et al. CCAA, 18:1973-1980, 2008; 6) Dale et al. Neuroimage, 9:179-194, 1999; 7) Van Essen et al. JAMIA, 8:443-459, 2001; 8) Brodmann. J. A. Barth: Leipzig, 1909; 9) Rypma et al. Neuroimage, 33:969-679, 2006; 10) Weschler. Psych Corp.: TX, 1997; 11) Cox. Comput Biomed Res, 29:162-173, 1996; 12) Cohen et al. Nature: 386, 604-608, 1997; 13) MATLAB®. The MathWorks, Natick, MA, 2007; 14) SAS Software (Version 9.1) [Computer software]. SAS Institute: Cary, NC, 2003; 15) Rypma. Neuroscience, 139:223-235 (2006). This study was supported by IDIQ contract VA549-P-0027, awarded and administered by the Department of Veterans Affairs Medical Center, Dallas, TX, and by NIH (NCRR) Grant Number UL1RR024982. The content does not necessarily reflect the position or the policy of the Federal government or the sponsoring agencies, and no official endorsement should be inferred. Proc. Intl. Soc. Mag. Reson. Med. 18 (2010) 3456


