Regional CBV Characteristics in Normal Subjects and its Relation to...
advertisement
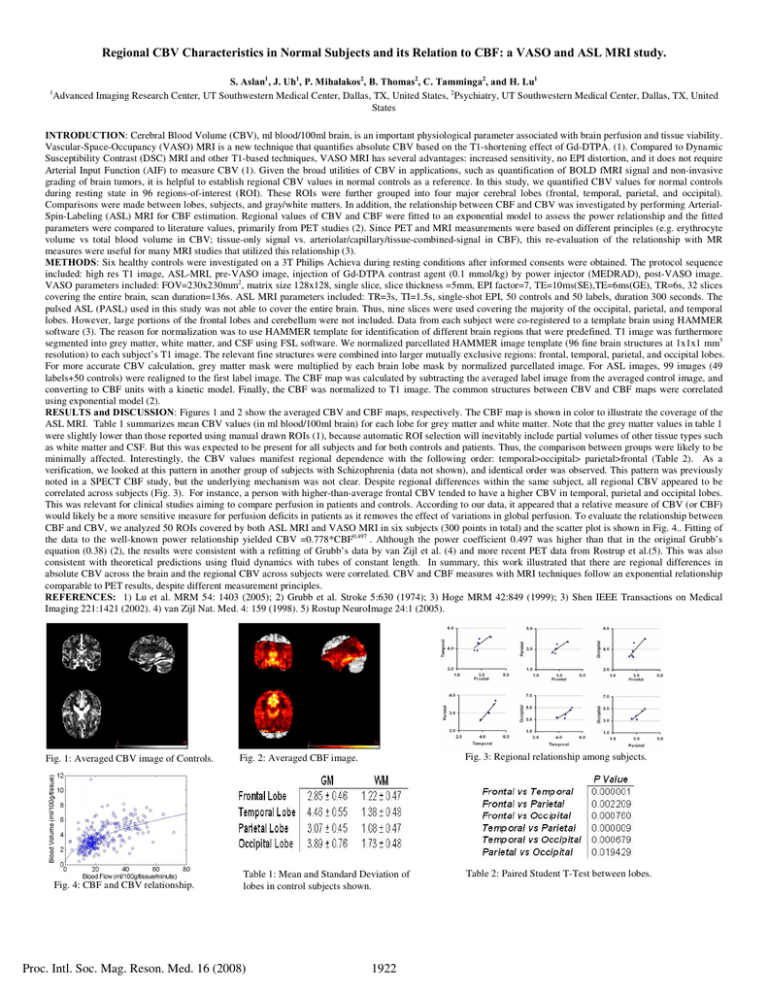
Regional CBV Characteristics in Normal Subjects and its Relation to CBF: a VASO and ASL MRI study. S. Aslan1, J. Uh1, P. Mihalakos2, B. Thomas2, C. Tamminga2, and H. Lu1 Advanced Imaging Research Center, UT Southwestern Medical Center, Dallas, TX, United States, 2Psychiatry, UT Southwestern Medical Center, Dallas, TX, United States 1 INTRODUCTION: Cerebral Blood Volume (CBV), ml blood/100ml brain, is an important physiological parameter associated with brain perfusion and tissue viability. Vascular-Space-Occupancy (VASO) MRI is a new technique that quantifies absolute CBV based on the T1-shortening effect of Gd-DTPA. (1). Compared to Dynamic Susceptibility Contrast (DSC) MRI and other T1-based techniques, VASO MRI has several advantages: increased sensitivity, no EPI distortion, and it does not require Arterial Input Function (AIF) to measure CBV (1). Given the broad utilities of CBV in applications, such as quantification of BOLD fMRI signal and non-invasive grading of brain tumors, it is helpful to establish regional CBV values in normal controls as a reference. In this study, we quantified CBV values for normal controls during resting state in 96 regions-of-interest (ROI). These ROIs were further grouped into four major cerebral lobes (frontal, temporal, parietal, and occipital). Comparisons were made between lobes, subjects, and gray/white matters. In addition, the relationship between CBF and CBV was investigated by performing ArterialSpin-Labeling (ASL) MRI for CBF estimation. Regional values of CBV and CBF were fitted to an exponential model to assess the power relationship and the fitted parameters were compared to literature values, primarily from PET studies (2). Since PET and MRI measurements were based on different principles (e.g. erythrocyte volume vs total blood volume in CBV; tissue-only signal vs. arteriolar/capillary/tissue-combined-signal in CBF), this re-evaluation of the relationship with MR measures were useful for many MRI studies that utilized this relationship (3). METHODS: Six healthy controls were investigated on a 3T Philips Achieva during resting conditions after informed consents were obtained. The protocol sequence included: high res T1 image, ASL-MRI, pre-VASO image, injection of Gd-DTPA contrast agent (0.1 mmol/kg) by power injector (MEDRAD), post-VASO image. VASO parameters included: FOV=230x230mm2, matrix size 128x128, single slice, slice thickness =5mm, EPI factor=7, TE=10ms(SE),TE=6ms(GE), TR=6s, 32 slices covering the entire brain, scan duration=136s. ASL MRI parameters included: TR=3s, TI=1.5s, single-shot EPI, 50 controls and 50 labels, duration 300 seconds. The pulsed ASL (PASL) used in this study was not able to cover the entire brain. Thus, nine slices were used covering the majority of the occipital, parietal, and temporal lobes. However, large portions of the frontal lobes and cerebellum were not included. Data from each subject were co-registered to a template brain using HAMMER software (3). The reason for normalization was to use HAMMER template for identification of different brain regions that were predefined. T1 image was furthermore segmented into grey matter, white matter, and CSF using FSL software. We normalized parcellated HAMMER image template (96 fine brain structures at 1x1x1 mm3 resolution) to each subject’s T1 image. The relevant fine structures were combined into larger mutually exclusive regions: frontal, temporal, parietal, and occipital lobes. For more accurate CBV calculation, grey matter mask were multiplied by each brain lobe mask by normalized parcellated image. For ASL images, 99 images (49 labels+50 controls) were realigned to the first label image. The CBF map was calculated by subtracting the averaged label image from the averaged control image, and converting to CBF units with a kinetic model. Finally, the CBF was normalized to T1 image. The common structures between CBV and CBF maps were correlated using exponential model (2). RESULTS and DISCUSSION: Figures 1 and 2 show the averaged CBV and CBF maps, respectively. The CBF map is shown in color to illustrate the coverage of the ASL MRI. Table 1 summarizes mean CBV values (in ml blood/100ml brain) for each lobe for grey matter and white matter. Note that the grey matter values in table 1 were slightly lower than those reported using manual drawn ROIs (1), because automatic ROI selection will inevitably include partial volumes of other tissue types such as white matter and CSF. But this was expected to be present for all subjects and for both controls and patients. Thus, the comparison between groups were likely to be minimally affected. Interestingly, the CBV values manifest regional dependence with the following order: temporal>occipital> parietal>frontal (Table 2). As a verification, we looked at this pattern in another group of subjects with Schizophrenia (data not shown), and identical order was observed. This pattern was previously noted in a SPECT CBF study, but the underlying mechanism was not clear. Despite regional differences within the same subject, all regional CBV appeared to be correlated across subjects (Fig. 3). For instance, a person with higher-than-average frontal CBV tended to have a higher CBV in temporal, parietal and occipital lobes. This was relevant for clinical studies aiming to compare perfusion in patients and controls. According to our data, it appeared that a relative measure of CBV (or CBF) would likely be a more sensitive measure for perfusion deficits in patients as it removes the effect of variations in global perfusion. To evaluate the relationship between CBF and CBV, we analyzed 50 ROIs covered by both ASL MRI and VASO MRI in six subjects (300 points in total) and the scatter plot is shown in Fig. 4.. Fitting of the data to the well-known power relationship yielded CBV =0.778*CBF0.497 . Although the power coefficient 0.497 was higher than that in the original Grubb’s equation (0.38) (2), the results were consistent with a refitting of Grubb’s data by van Zijl et al. (4) and more recent PET data from Rostrup et al.(5). This was also consistent with theoretical predictions using fluid dynamics with tubes of constant length. In summary, this work illustrated that there are regional differences in absolute CBV across the brain and the regional CBV across subjects were correlated. CBV and CBF measures with MRI techniques follow an exponential relationship comparable to PET results, despite different measurement principles. REFERENCES: 1) Lu et al. MRM 54: 1403 (2005); 2) Grubb et al. Stroke 5:630 (1974); 3) Hoge MRM 42:849 (1999); 3) Shen IEEE Transactions on Medical Imaging 221:1421 (2002). 4) van Zijl Nat. Med. 4: 159 (1998). 5) Rostup NeuroImage 24:1 (2005). Fig. 1: Averaged CBV image of Controls. Fig. 4: CBF and CBV relationship. Fig. 3: Regional relationship among subjects. Fig. 2: Averaged CBF image. Table 1: Mean and Standard Deviation of lobes in control subjects shown. Proc. Intl. Soc. Mag. Reson. Med. 16 (2008) 1922 Table 2: Paired Student T-Test between lobes.
