Measurements of Near Wall Turbulent Structure in a Microbubble Flow... Telecentric PIV/PTV System
advertisement
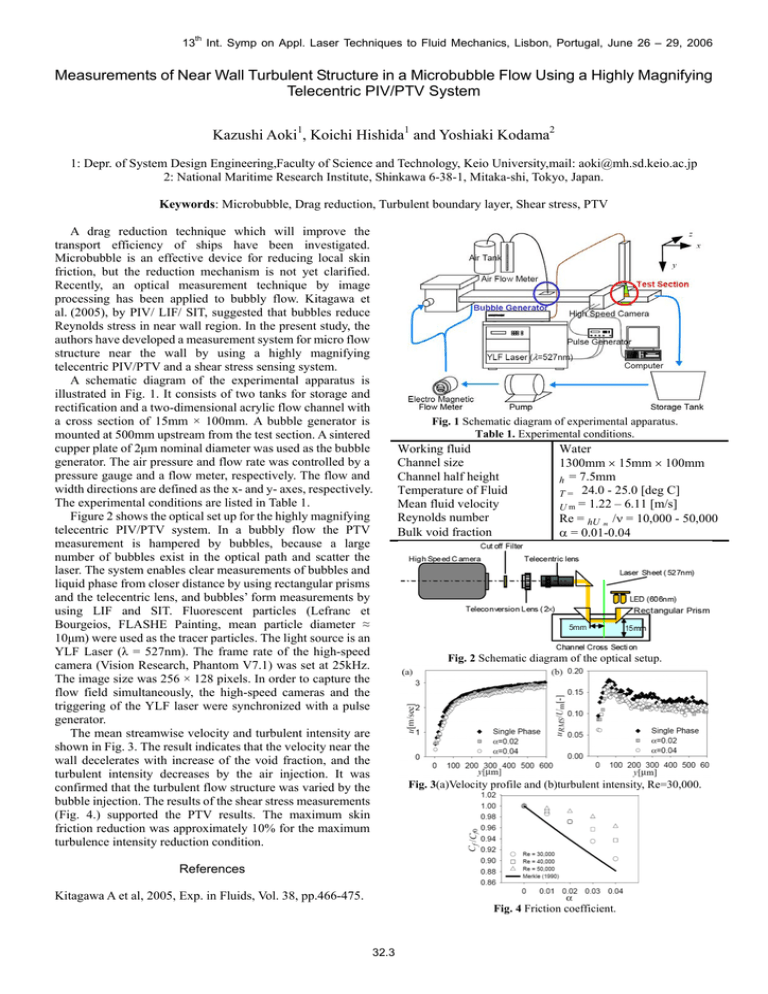
13th Int. Symp on Appl. Laser Techniques to Fluid Mechanics, Lisbon, Portugal, June 26 – 29, 2006 Measurements of Near Wall Turbulent Structure in a Microbubble Flow Using a Highly Magnifying Telecentric PIV/PTV System Kazushi Aoki1, Koichi Hishida1 and Yoshiaki Kodama2 1: Depr. of System Design Engineering,Faculty of Science and Technology, Keio University,mail: aoki@mh.sd.keio.ac.jp 2: National Maritime Research Institute, Shinkawa 6-38-1, Mitaka-shi, Tokyo, Japan. Keywords: Microbubble, Drag reduction, Turbulent boundary layer, Shear stress, PTV A drag reduction technique which will improve the transport efficiency of ships have been investigated. Microbubble is an effective device for reducing local skin friction, but the reduction mechanism is not yet clarified. Recently, an optical measurement technique by image processing has been applied to bubbly flow. Kitagawa et al. (2005), by PIV/ LIF/ SIT, suggested that bubbles reduce Reynolds stress in near wall region. In the present study, the authors have developed a measurement system for micro flow structure near the wall by using a highly magnifying telecentric PIV/PTV and a shear stress sensing system. A schematic diagram of the experimental apparatus is illustrated in Fig. 1. It consists of two tanks for storage and rectification and a two-dimensional acrylic flow channel with a cross section of 15mm × 100mm. A bubble generator is mounted at 500mm upstream from the test section. A sintered cupper plate of 2μm nominal diameter was used as the bubble generator. The air pressure and flow rate was controlled by a pressure gauge and a flow meter, respectively. The flow and width directions are defined as the x- and y- axes, respectively. The experimental conditions are listed in Table 1. Figure 2 shows the optical set up for the highly magnifying telecentric PIV/PTV system. In a bubbly flow the PTV measurement is hampered by bubbles, because a large number of bubbles exist in the optical path and scatter the laser. The system enables clear measurements of bubbles and liquid phase from closer distance by using rectangular prisms and the telecentric lens, and bubbles’ form measurements by using LIF and SIT. Fluorescent particles (Lefranc et Bourgeios, FLASHE Painting, mean particle diameter ≈ 10μm) were used as the tracer particles. The light source is an YLF Laser (λ = 527nm). The frame rate of the high-speed camera (Vision Research, Phantom V7.1) was set at 25kHz. The image size was 256 × 128 pixels. In order to capture the flow field simultaneously, the high-speed cameras and the triggering of the YLF laser were synchronized with a pulse generator. The mean streamwise velocity and turbulent intensity are shown in Fig. 3. The result indicates that the velocity near the wall decelerates with increase of the void fraction, and the turbulent intensity decreases by the air injection. It was confirmed that the turbulent flow structure was varied by the bubble injection. The results of the shear stress measurements (Fig. 4.) supported the PTV results. The maximum skin friction reduction was approximately 10% for the maximum turbulence intensity reduction condition. Fig. 1 Schematic diagram of experimental apparatus. Table 1. Experimental conditions. Working fluid Channel size Channel half height Temperature of Fluid Mean fluid velocity Reynolds number Bulk void fraction Water 1300mm × 15mm × 100mm h = 7.5mm T = 24.0 - 25.0 [deg C] U m = 1.22 – 6.11 [m/s] Re = hU m /ν = 10,000 - 50,000 α = 0.01-0.04 Fig. 2 Schematic diagram of the optical setup. Fig. 3(a)Velocity profile and (b)turbulent intensity, Re=30,000. References Kitagawa A et al, 2005, Exp. in Fluids, Vol. 38, pp.466-475. Fig. 4 Friction coefficient. 32.3


