Measurement of the Aerodynamic Forces on a small Particle.
advertisement

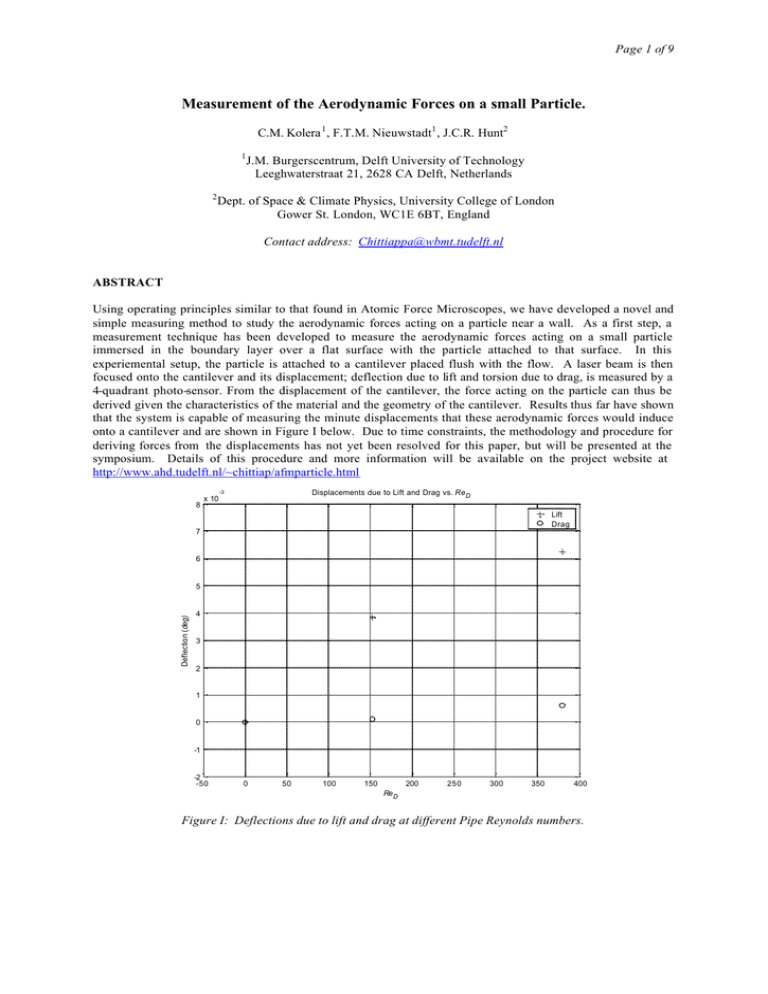
Page 1 of 9 Measurement of the Aerodynamic Forces on a small Particle. C.M. Kolera 1 , F.T.M. Nieuwstadt1 , J.C.R. Hunt2 1 2 J.M. Burgerscentrum, Delft University of Technology Leeghwaterstraat 21, 2628 CA Delft, Netherlands Dept. of Space & Climate Physics, University College of London Gower St. London, WC1E 6BT, England Contact address: Chittiappa@wbmt.tudelft.nl ABSTRACT Using operating principles similar to that found in Atomic Force Microscopes, we have developed a novel and simple measuring method to study the aerodynamic forces acting on a particle near a wall. As a first step, a measurement technique has been developed to measure the aerodynamic forces acting on a small particle immersed in the boundary layer over a flat surface with the particle attached to that surface. In this experiemental setup, the particle is attached to a cantilever placed flush with the flow. A laser beam is then focused onto the cantilever and its displacement; deflection due to lift and torsion due to drag, is measured by a 4-quadrant photo-sensor. From the displacement of the cantilever, the force acting on the particle can thus be derived given the characteristics of the material and the geometry of the cantilever. Results thus far have shown that the system is capable of measuring the minute displacements that these aerodynamic forces would induce onto a cantilever and are shown in Figure I below. Due to time constraints, the methodology and procedure for deriving forces from the displacements has not yet been resolved for this paper, but will be presented at the symposium. Details of this procedure and more information will be available on the project website at http://www.ahd.tudelft.nl/~chittiap/afmparticle.html Displacements due to Lift and Drag vs. Re D -3 8 x 10 Lift Drag 7 6 Deflection (deg) 5 4 3 2 1 0 -1 -2 -50 0 50 100 150 200 250 300 350 400 Re D Figure I: Deflections due to lift and drag at different Pipe Reynolds numbers. Page 2 of 9 1. Introduction Many numerical models for simulating a turbulent dispersed two-phase flow rely on the Lagrangian computation of particle trajectories within an Eulerian simulation of the flow field. In order to compute the particle trajectory realistically from its equation of motion one needs to know the aerodynamical forces i.e. the lift and drag on the particle accurately. Most theoretical and experimental expressions for these forces are valid for a single spherical particle in an unbounded flow. Much less is known for these forces for the case of a particle in the neighbourhood of a solid surface, which is relevant for deposition or suspension. Many studies have sought to address this problem, the most notable being Saffman (1965), which most subsequent studies have used as a starting point e.g. Segre and Silberberg (1962), Leal (1980), Dandy and Dwyer (1990), Kurose and Komori (1999), Lataste et al. (2000), Magnaudet (2003). As a first step towards investigating the forces on a particle near a wall, we have set out to measure the forces on a particle in a boundary layer over a flat surface with the particle attached to the surface. We restrict ourselves to a particle that is small enough to be fully immersed in the viscous sub-layer. This particle experiences a velocity gradient normal to the wall and as a result a lift and drag force (FD >> FL ) as shown in Figure 1. However, herein lies another conundrum, in that for experimental reasons, it is much simpler to start with a particle attached to the wall, but from the theoretical studies mentioned above, this case turns out to be a much more difficult problem to solve. U(y) y FL x FD Figure 1: Forces acting on a particle on a wall due to the velocity gradient present in the viscous sublayer. We use a measuring technique derived from Atomic Force Microscopy (AFM). In our experimental setup, a particle is attached to a cantilever placed flush with the flow. A laser beam is then focused onto the cantilever and its displacement; bending due to lift and torsion due to drag, is measured by a 4-quadrant photo-sensor. This is conceptually shown in Figure 2. From the displacement of the cantilever, the force acting on the particle can thus be derived given the characteristics of the material and the geometry of the cantilever. A similar study done by Mollinger (1996) utilised the same AFM principle, but was restricted to measure the lift force only. Laser Sensor Cantilever Particle Figure 2: Conceptual details of the AFM technique. Also shown is the response of the reflected beam to the cantilever displacements Page 3 of 9 2. Apparatus and Instrumentation As previously mentioned, the techniques used for this experimental study have been derived from that used in AFM. The basic principles of the were adapted so as to be able to accomplish the goals of the study. Described in this section are the different distinct parts of the set-up, which when combined, provide what we think is a simple but novel experimental technique. 2.1. Cantilever and particle The cantilevers are made of Silicon Nitride and have a width of 70µm with a thickness of 2µm thick. The length has been varied to increase or decrease the bending sensitivity. The particles used are Dualite MS7000 polymeric microspheres with a diameter of 80µm, and are glued to the cantilevers using light sensitive glue. Shown in Figure 2 is a photograph of a particle attached to a cantilever. Figure 3 : Cantilever with particle The cantilever with particle is then placed in a test section which is designed to be the outflow section of a pipe flow facility (described in section 2.2). 2.2. Pipe flow facility A pipe flow facility has been designed and constructed to give a fully developed flow at the test section. From a reservoir of bottled nitrogen, the flow is controlled with a mass-flow controller, passed through a settling chamber to remove any unwanted fluctuations and then directed into the pipe. This configuration is shown schematically in Figure 3. The pipe has a diameter of 0.01m, and a length of 2m (L/D = 200), to ensure the flow is fully developed at the test section. Mass flow controller 2.0m Pipe section Bottled Nitrogen Test section Settling chamber Figure 4: Schematic of the pipe flow facility The mass-flow controller is capable of producing flow speeds that are low and steady, which is useful for testing at low Particle Reynolds numbers. Since the flow is fully developed at the pipe exit, the bulk velocity in the pipe Ub is given by the expression Eq (1) U = Q/ A b where Q is the volumetric flow rate generated by the controller, and A is the cross-sectional area of the pipe. From this, the Reynolds number based on pipe diameter, ReD , can be computed, and making the assumption that the particle is in the viscous sublayer of the boundary layer, the Particle Reynolds number, Rep can be computed with the following expression Eq (2) Re = 2 Re ( a / R) 2 p D Page 4 of 9 where a is the particle radius, and R is the radius of the pipe. Given in Table 1 are the characteristics of the flow as generated by the controller. Table 1: Flow characteristics of the mass-flow controller Q (ml/min) Ub (m/s) ReD Rep 500 0.106 76 0.009 1000 0.212 152 0.019 1500 0.318 227 0.029 2000 0.424 303 0.039 2500 0.531 379 0.048 As stated previously, the tes t section attached at the end of the pipe accommodates the cantilever with particle, and is deliberately placed at the exit of the pipe flow facility to ensure that the static pressure acting on the cantilever is equal to the ambient air pressure. This ensures that the cantilever is not displaced due to ambient pressure changes. A photograph of the test section is shown in Figure 4. The test section is built such that it can be detached from the pipe section, to enable the cantilever to be fixed to it. A second and unexpected benefit of this design manifested itself during the calibration procedure and will be explained in section 2.4. Figure 5: Test section showing the cantilever, and pipe cross-section. 2.3. Optical setup and Instrumentation As shown in Figure 1, a laser beam is focused onto the cantilever, and the reflected beam is then tracked using a four quadrant photo detector. The beam from a 20 mW HeNe laser is focused into a spot of approximately 40µm through a sequence of pinholes and lenses . The reflected beam is then focused onto the sensor through a lens, and the spot size can be varied by changing the distance between the sensor and lens. Each quadrant of the photo-sensor generates an electric voltage which is then passed through amplifying circuitry and the signals (explained in more detail in section 2.4) are then recorded using a PC based data acquisition system running Labview® software. The system consists of a 12 bit National Instruments E-series PCI bus multi-channel AD board capable of taking 2 MSamples/s. The data presented in this paper was the result of averaging 50 blocks of 5000 data samples taken at a sampling frequency of 10kHz. 2.4. Calibration In order to obtain a force measurement from the set-up i.e. from the deflection of the reflected spot to a force, the system needs to be calibrated. There are two calibration steps that must be taken. They are; • • Calibration of the photo-sensor to detect the displacement of the cantilever Calibration of the cantilever to determine its structural properties in order to derive a force from the displacement. To calibrate the photo-sensor for displacements, a relationship between the displacement and the sensor-output must be obtained. The simplest and most efficient way to go about doing this is to deflect the cantilever with known displacements, and record the corresponding output. Deflecting the cantilever while it is attached to the pipe flow facility is not feasible, which meant that a separate calibration cantilever is needed that could be set at different displacements. This introduces an uncertainty in the measurement due to the position of the beam which may have to be readjusted between the test section and a calibration section., but as mentioned in section Page 5 of 9 2.2, the fact that the test section is detachable from the pipe section resulted in a convenient calibration scheme to eliminate this uncertainty. In order to manipulate the cantilever to known displacements, a very simple but effective calibration jig was designed which ensured that the cantilever stayed along the same beam path between calibration and measurement. It consists of two goniometers (M-GON65-U/L goniometers from Newport Optics), mounted together with the test section placed such that the cantilever is located at the center of rotation of the goniometers. When the measurements are made, the test section is reattached to the pipe section, and returned to the jig, thereby ensuring that the optical path of the beam is unchanged between the calibration and measurement. This is shown in Figure 6, where the test section is shown on the jig, with the pipe section detached from it. Figure 6: The test section mounted on the calibration jig. Also visible is the pipe section which has the guiding pins for proper alignement and attachement between the two parts.. Since the experiment needs to measure the displacement due to lift and drag (hereafter referred to as the deflection and the torsion) of the cantilever, two signals corresponding to each are needed. The layout and notation of the four-quadrant is shown in Figure 7. Figure 7: Photo-sensor quadrant notation Page 6 of 9 The signals recorded from the photo-sensor are (refer to Figure 7 for quadrant notation); VDeflection = ( A + B) − (C + D ) VTorsion = ( A + D ) − (C + B) Eq (1) Vsum = A + B + C + D From the above definitions, the deflection of the cantilever results in the reflected laser spot moving between the top and bottom half of the sensor, and the torsion of the cantilever results in a left to right motion (see also Figure 2). A third signal Vsum ; the summation of the four quadrants (A + B + C + D) is also recorded, and used as a normalising parameter to eliminate uncertainties due to fluctuating intensities of the beam. It also works as an indication of whether the reflected spot is exceeding the bounds of the sensor due to excessive deflections of the cantilever. Due to the fact that the deflections are expected to be very small, the resolution of the measurement is further enhanced by applying offset voltages to the signals, and amplifying the corresponding voltage difference. A convenient aspect of using these definitions of the deflection and torsion, are that the two signals are independent of one another for the displacements expected in this measurement i.e. for a given deflection, as the torsion is varied, the deflection does not change. This implies that a single variable relationship can be derived for the sensor-output vs. displacement. Thus, the cantilever is pitched and rolled through a range of angles, and the corresponding deflection and torsion signals recorded. Depending on the results either a linear or polynomial curve fit is can be calculated, thus an expression relating the signal and deflection can be obtained. The calibration curves are shown in Figure 8. Deflection calibration curve Torsion calibration curve 0.1 measurement best fit 0.85 0 0.8 -0.1 Output (V) Output (V) measurement best fit 0.75 -0.2 0.7 -0.3 0.65 -0.4 0.6 -0.2 -0.1 0 0.1 Deflection (degrees) 0.2 -0.5 -0.2 -0.1 0 0.1 Deflection (degrees) 0.2 Figure 8: Deflection and Torsion calibration curves with the derived relationship From the plots shown in Figure 8, the linear expressions for the deflection and torsion are given by the following equations Deflection = 2.43VDeflection − 1.87 o Torsion o = −0.91VTorsion − 0.16 Eq (2) Page 7 of 9 Calibration of the structural properties of the cantilever is a very complicated and difficult procedure, and is a topic that can be studied in its own right when considering AFM type studies e.g. Sader et al. (1995), Cain et al. (2001), Burnham et al., (2003). Due to this fact, structural calibration of the cantilevers is currently ongoing, and could not be included in this paper due to time constraints. A procedure similar to that outlined in a study by Cleveland et al. (1993) which relates the resonance frequency of the cantilever to an equivalent spring constant from which the force can be determined will be used. However, this will be completed for the presentation, and will be presented at that time. 3. Results While actual force measurements are forthcoming, the displacements induced by the aerodynamic forces on the cantilever have been measured and recorded. 50 sets of 5000 samples at a sampling frequency of 10kHz were taken for various flow speeds. Due to the added mass of the particle, the cantilever will have an initial deflection to begin with. Thus, before and after each measurement, a no-flow measurement is also taken, and is defined as zero lift and drag. This implies that the displacements are given in terms of deviations from the no flow case. Given in Table 2, are the displacements due to lift and drag at different flow speeds. Table 2: Displacements of the cantilever due to lift and drag at different Reynolds numbers Ub (m/s) ReD Rep Lift (degrees) Drag (degrees) 0 0 0 0 0 0.212 152 0.019 3.8x10⁻³ 1.0x10⁻⁴ 0.531 227 0.048 6.2x10⁻³ 6.0x10⁻⁴ Shown if Figure 9, are the results of two measurements, showing the deflection due to the lift and drag. 8 x 10 Displacements due to Lift and Drag vs. Re D -3 Lift Drag 7 6 Deflection (deg) 5 4 3 2 1 0 -1 -2 -50 0 50 100 150 200 Re 250 300 350 400 D Figure 9: Deflections due to lift and drag at different Pipe Reynolds numbers. From these results, it can be seen that the lift and drag both increase with increasing Reynolds numbers, which is to be expected, as with faster flow speeds, the lift and drag both increase. The fact that the deflection is much Page 8 of 9 larger than the torsion, even though the drag force is larger than the lift force is due to the structural properties of the cantilever. A beam-shaped cantilever such as the one used here, is more sensitive to a deflection than to torsion, resulting in a larger deviation. As part of the project, one aim is to study the effect of using different geometries for cantilevers in order to increase the sensitivity response of one signal over the other. 4. Conclusions Using operating principles similar to that found in Atomic Force Microscopes, a novel and simple means of using lasers and optics has been developed to study fluid flow phenomena. A measurement technique has been developed to measure the aerodynamic forces acting on a small particle attached to a cantilever and immersed in the boundary layer of a pipe flow. Results thus far have shown that the system is capable of measuring the minute displacements that these aerodynamic forces would induce onto a cantilever. Due to time constraints, the methodology and procedure for deriving forces from the displacements has not yet been resolved for this paper, but will be presented at the symposium. Details of this procedure will be available on the project website. Ultimately, results from this measurement setup will be compared to current theoretical predictions of the force, and hopefully provide some useful information and data in order to further develop these models and predictions. One more ambitious plan in this study is to see if it is feasible to perform the same measurements but with the particle slightly above the surface. With current MEMS technology, it may be possible to make a cantilever with a micro-post etched onto it, thus simulating a particle just above the wall to which many accurate and dependable prediction schemes are available. More information can be found on the project website : http://www.ahd.tudelft.nl/~chittiap/afmparticle.html 5. Acknowledgements This project has been funded by the Foundation for Fundamental Research on Matter (FOM), the largest government-supported physics organization in the Netherlands, and the authors gratefully acknowledge this assistance. 6. References Comparison of calibration methods for atomic-force microscopy cantilevers, Burnham, N.A., Chen, X., Hodges, C.S., Matei, G.A., Thorensen, E.J., Roberts, C.J., Davies, M.C., Tendler, S.J.B., Nanotechnology, 14, pgs: 1-6, 2003. Quantitative comparison of three calibration techniques for the lateral force microscope, Cain, R.G., Reitsma, M.G., Biggs, S., Page, N.W., Review of Scientific Instruments, vol 72(8), pgs: 3304-3312, 2001. A nondestructive method for determining the spring constant of cantilevers for scanning force microscopy, Cleveland, J. P., Manne, S., Bocek, D., Hansma, P.K., Review of Scientific Instruments, vol 64(2), pgs: 403-405, February 1993. A sphere in shear flow at finite Reynolds number:effect of shear of particle lift, drag, and heat transfer, Dandy, D.S., Dwyer, H.A., Journal of Fluid Mechanics, vol 216, pgs: 381-410, 1990. Drag and Lift forces on a rotating sphere in a linear shear flow, Kurose, R., Komori, S., Journal of Fluid Mechanics, vol 384, pgs:183-206, 1999. On the shear lift force acting on heavy particles in a turbulent boundary layer, Lataste, J., Huilier, D., Burnage, H., Bednar, J, Atmospheric Environment, 34, pgs: 3963-3971, 2000. Particle motions in a viscous fluid, Leal L.G., Annual Review of Fluid Mechanics, 12, pgs: 435-475, 1980. Small inertial effects on a spherical bubble, drop, or particle moving near a wall in a time dependant linear flow, Magnaudet, J., Journal of Fluid Mechanics, vol 485, pgs: 115-142, 2003. Measurement of the lift force on a particle fixed to the wall in the viscous sublayer of a fully developed turbulent boundary layer, Mollinger, A.M, Nieuwstadt, F.T.M, Journal of Fluid Mechanics vol 316 pgs : 285-306, 1996. Page 9 of 9 Method for the calibration of atomic force microscope cantilevers, Sader J.E., Larson, I., Mulvaney, P, White, L.R., Review of Scientific Instruments, vol 66(7), pgs: 3789-3798, 1995 The lift on a small sphere in a slow shear flow, Saffman P.G., Journal of Fluid Mechanics, vol 22, pgs: 385400, (1965). Behaviour of Macroscopic rigid spheres in Pouiseille flow, part 1, Segre, G., Silberberg, A., Journal of Fluid Mechanics, vol 14, pgs: 115-135, 1962. Behaviour of Macroscopic rigid spheres in Pouiseille flow, part 2, Segre, G., Silberberg, A., Journal of Fluid Mechanics, vol 14, pgs: 136-157, 1962.


