Lagrangian Analysis of passive tracers dispersion in a confined convective...
advertisement
Lagrangian Analysis of passive tracers dispersion in a confined convective flow
by
Stefania Espa*, Giorgio Querzoli**
*Dipartimento di Idraulica, Trasporti e Strade
Università "La Sapienza", Via Eudossiana 18, 00184-Roma, Italy
**Dipartimento di Ingegneria del Territorio
Università di Cagliari, P.zza d’Armi,1 90123-Cagliari, Italy
ABSTRACT
Lagrangian motion in a quasi-two dimensional time dependent, convective flow is studied at different
Rayleigh numbers (Ra). Convective motion is generated in a rectangular tank by a linear heat source
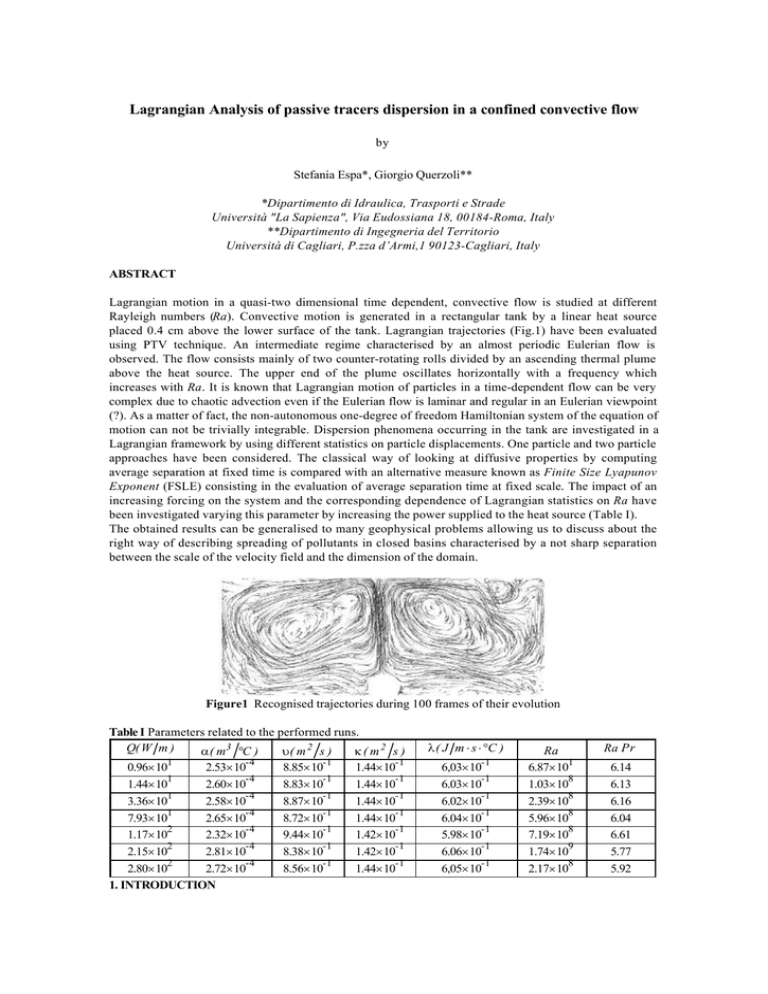
placed 0.4 cm above the lower surface of the tank. Lagrangian trajectories (Fig.1) have been evaluated
using PTV technique. An intermediate regime characterised by an almost periodic Eulerian flow is
observed. The flow consists mainly of two counter-rotating rolls divided by an ascending thermal plume
above the heat source. The upper end of the plume oscillates horizontally with a frequency which
increases with Ra. It is known that Lagrangian motion of particles in a time-dependent flow can be very
complex due to chaotic advection even if the Eulerian flow is laminar and regular in an Eulerian viewpoint
(?). As a matter of fact, the non-autonomous one-degree of freedom Hamiltonian system of the equation of
motion can not be trivially integrable. Dispersion phenomena occurring in the tank are investigated in a
Lagrangian framework by using different statistics on particle displacements. One particle and two particle
approaches have been considered. The classical way of looking at diffusive properties by computing
average separation at fixed time is compared with an alternative measure known as Finite Size Lyapunov
Exponent (FSLE) consisting in the evaluation of average separation time at fixed scale. The impact of an
increasing forcing on the system and the corresponding dependence of Lagrangian statistics on Ra have
been investigated varying this parameter by increasing the power supplied to the heat source (Table I).
The obtained results can be generalised to many geophysical problems allowing us to discuss about the
right way of describing spreading of pollutants in closed basins characterised by a not sharp separation
between the scale of the velocity field and the dimension of the domain.
Figure1 Recognised trajectories during 100 frames of their evolution
Table I Parameters related to the performed runs.
Q( W m )
α ( m3 °C )
υ( m 2 s )
κ( m2 s )
1
-4
-1
-1
0.96×10
2.53×10
8.85×10
1.44×10
1
-4
-1
-1
1.44×10
2.60×10
8.83×10
1.44×10
1
-4
-1
-1
3.36×10
2.58×10
8.87×10
1.44×10
1
-4
-1
-1
7.93×10
2.65×10
8.72×10
1.44×10
2
-4
-1
-1
1.17×10
2.32×10
9.44×10
1.42×10
2
-4
-1
-1
2.15×10
2.81×10
8.38×10
1.42×10
2
-4
-1
-1
2.80×10
2.72×10
8.56×10
1.44×10
1. INTRODUCTION
λ ( J m ⋅ s ⋅ °C )
-1
6,03×10
-1
6.03×10
-1
6.02×10
-1
6.04×10
-1
5.98×10
-1
6.06×10
-1
6,05×10
Ra
1
6.87×10
8
1.03×10
8
2.39×10
8
5.96×10
8
7.19×10
9
1.74×10
8
2.17×10
Ra Pr
6.14
6.13
6.16
6.04
6.61
5.77
5.92
The understanding of transport and mixing properties of passive impurities in fluid flows is of great
concern in several fields of theoretical and applied research including oceanography, biophysics and
chemical engineering.
During the past decades, transport has been extensively studied using different approaches and
methodologies. Recently, the classical approach based on the concepts of turbulent diffusion (Taylor,
1921), has been extended using dynamical system theory concepts and especially chaotic dynamics
(Ottino, 1989). The most natural framework for investigating passive scalar dynamics is a Lagrangian
viewpoint in which particles result advected by a given Eulerian velocity field u( x, t ) . However, in spite of
the simple formal relation between Eulerian and Lagrangian approach, it can not be always a trivial task to
obtain information on one description starting from the other. As a matter of fact it can be shown that
totally impredictable Lagrangian motion (i.e. chaotic motion) can exist also in a laminar and totally
predictable Eulerian velocity field (Aref, 1983-1984). This phenomena is referred to Lagrangian chaos
which can be denoted as the sensitivity to initial conditions of Lagrangian trajectories (Crisanti et al.,
1991). Moreover in closed domains, asymptotic mixing properties of the flow are strongly influenced by
the presence of boundaries in particular when the characteristic length scale of the vortices is of the same
order of the dimension domain (Artale et al., 1997).
Convective flows can be created ranging from time-independent, spatially periodic flow to turbulent flows
by varying some control parameter e.g. Rayleigh number, Ra. As a consequence transport rates vary over
a wide range (Solomon & Gollub, 1998). These systems represent then a good model system for a
comprehensive investigation of transport: when the fluid is motionless, the transport is entirely due to
molecular diffusion; at the opposite extreme (turbulent flow) transport is due to advection by the flow.
There are two relevant laminar flow regimes in between these extremes: a time-independent and a timeperiodic regime. In the time-independent regime, large-scale transport is limited by molecular diffusion
between adjacent rolls while in the time-periodic regime transport is dominated by advection of tracers’
particles across their boundaries. In order to analyze and to quantify the different mechanisms that lead to
transport enhancement, alternative concepts and tools based on the dynamical systems theory have to
(should) be considered and compared to the usual diffusion coefficients.
Following this idea, the study of an unsteady, quasi-two-dimensional, convective system has been
experimentally carried out by analyzing the behavior of a thermal above a cross-sectional linear heat
source located in the mid-line above the bottom surface of a rectangular tank filled up with water.
In these conditions, the buoyancy induces a flow characterized by two counter-rotating vortices separated
by an ascending plume that, beyond a certain value of the Rayleigh number oscillates almost periodically
in a plane perpendicular to the heat source. The dimension of these structures, is of the order of the length
of the vessel. The symmetry of this field is broken by the formation of smaller structures that alternatively
determine an oscillation of the upward current in the right and left half-field of the fluid domain. Such
configuration remains unchanged in a wide interval of variation of the control parameter allowing the
study of the dependency of Lagrangian quantities on it.
Lagrangian description of the fluid motion is obtained by means of Particle Tracking Velocimetry (PTV)
technique. The characteristics of regularity, two-dimensionality and symmetry of the analyzed flow have
allowed tracking a great number of particles for time intervals greater than the characteristic time-scales of
the flow. A description of the fluid flow in an Eulerian framework can be obtained too from Lagrangian
data. As a result one takes a spatio-temporal description of the velocity field with a higher frequency than
those characteristics of the investigated phenomenon.
Different Lagrangian statistics on particles displacements have been evaluated in order to quantify
dispersion phenomena. The approaches based on one particle statistics (absolute dispersion) and two
particle statistics (relative dispersion, Finite Size Lyapunov Exponent) are then compared to discuss about
the more suitable methodology for studying tracers dispersion in analogous problems.
2. EXPERIMENTAL METHOD
2
2.1 Experimental set-up
The experimental set-up consists of a rectangular tank filled with water. Horizontal dimensions of the tank
are L=15.0 cm×D=10.4 cm and its vertical dimension is H=6cm. Figure 2 shows the vessel and the optical
configuration utilized in this experiment. The upper and lower surfaces are 0.8 cm aluminum plates kept at
constant temperature by means of two heat exchangers where water flows at constant temperature. The
side walls of the tank are 1 cm in thickness and made of perspex and can be considered adiabatic. The
convection is generated by a linear heat source 0.8 cm in diameter placed near the bottom surface of the
tank in correspondence of the mid line of it. An internal electrical resistance connected to a stabilized
power supply heats the cylinder. It controls the heat flux furnished to the system with a precision of 2%.
The choice of positioning the heating element externally of the bottom surface (Miozzi et al., 1998), reveals
in a reduction in heat loss due to conduction phenomena allowing a better control of the heat flux supplied
to the system.
In this configuration, the system is controlled by three non-dimensional parameters: Rayleigh number,
Prandtl number and aspect ratio of the tank respectively:
Ra =
α ⋅ g ⋅Q ⋅H 3
;
υ ⋅κ ⋅ λ
Pr =
ν
;
κ
A=
L
= 0.4
H
where κ is the thermal diffusivity, λ the thermal conductivity, Q the linear heat flux, α the thermal
expansion coefficient, g the gravity acceleration, and υ the cinematic viscosity. The mean temperature of
the fluid which is needed to evaluate its physical properties, is probed by a thermocouple. In this
experiment, the fluid and the geometry of the tank have not been changed, consequently the complexity of
the system increases with Ra. This parameter is varied in the range 6 .87 ⋅ 107 ÷ 2 .17 ⋅ 10 9 by increasing
the power supplied to the heat source. It has to be noted that Rayleigh number is evaluated by
considering the linear heat flux instead of the temperature increment (Desryaud &Lauriat, 1993).
In each run, the heat exchangers on the horizontal surfaces and the electrical resistance of the heater are
activated about 3 hours before the beginning of acquisitions to avoid transient regime. Acquisitions last
for 2700s, during this period at least 22500 frames are digitized. Typically 900 particles are simultaneously
tracked for each frame.
The scaling parameters of the flow are obtained following a typical non-dimensional formulation of the
problem (Koschmider, 1993). Consequently we choose as unit length the height of the cell, H, and as unit
time the diffusive time tκ = H 2 / κ . The corresponding scale for the velocity can be obtained.
Heating element
Argon-Ion Laser(750mW)
H=6 cm
Light sheet
D=10.4 cm
Lower heat exchanger
L=15 cm
To the regulated power supply
Image Processing System
Video camera
Personal Computer
S-VHS Video Recorder
Figure 2 Experimental set-up.
2.2 Measuring technique
3
Particle Tracking Velocimetry technique, gives the Lagrangian description of the motion. Pollen particles of
a mean size of 50 µm have been used to seed water. The test section is a vertical plane orthogonal to the
wire placed in the middle of the tank and lighted by a 0.3 cm light sheet obtained by a 750 mW Argon-Ion
laser beam passing through a cylindrical lens. Single-exposed images are acquired by a standard CCD
camera placed orthogonally to the light sheet. After recording on S-VHS tape, these images are then
digitized at 8.33 Hz at a 752×576 pixel resolution.
A particle tracking algorithm allows trajectories reconstruction by following particles displacements at
different frames (Querzoli, 1996). The procedure for detecting particle locations is organized in three steps.
The digitized frames are firstly reduced to Boolean images where the non-zero values represents the
particle images while zeros are associated to the background. The Boolean image is then labeled for
identifying sets of connected non-zero pixels which are good candidate particle images. Finally these sets
are selected according a minimum and a maximum limit value on their areas and stored with a temporal
information. Trajectories can now be identified as time-ordered series of particle locations matching two
criteria indicating some threshold on the maximum velocity and acceleration related to the kinematic
characteristics of the analyzed flow field. Velocity samples are then evaluated by dividing the particle
displacements by the time interval between frames. To improve resolution, the velocities are actually
evaluated using the displacements between 3 digitized frames. Eulerian velocity fields are obtained in each
4 consecutive frames by interpolating on a regular 15×35 grid. Although PTV allows for the evaluation of
velocity vectors with high local accuracy and assures a statistical independence of data, this procedure of
interpolation should be carefully carried out in order to avoid errors (Adrian, 1991).
2.3 Experimental observations
It has been experimentally observed that when convection starts, an ascending plume rises above the heat
source and a descending flow is noted in correspondence of the side walls of the tank. This circulation
organized in two counter rotating rolls divided by a buoyant plume exhibiting a natural swaying motion
almost periodical in a plane perpendicular to the wire. No meandering instabilities in the transversal
direction has been noted in the examined range of Rayleigh number.
As already discussed, previous experimental and numerical evidences (Miozzi et al, 1998; Desrayaud &
Lauriat, 1993), show that this flow, is characterized by an alternation of different vortical structures
depending on the presence of the plume on the left or on the right of the tank. In particular two dominant
structures form on the same side of the tank where the plume bends while, on the other side, only one
circulation exists. Previous studies (Miozzi and Querzoli., 1996) have shown the Eulerian features of this
flow, we recover here the same flow configuration. Figure 3 shows the mean velocity field corresponding
to the run Ra = 7. 2 ⋅ 10 8 obtained by averaging over the whole acquisition (~5620 frames). In Figure 4 the
horizontal component of this velocity field in a point located 0.8H above the heat source is plotted. The
time periodicity corresponding to the thermal plume can be easily observed.
1 6
1 4
1 2
1 0
8
6
4
2
0
0
5
1 0
1 5
2 0
2 5
3 0
3 5
Figure 3 Mean velocity field at Ra = 7. 2 ⋅ 10 8 .
4
4 0 0 0
3 0 0 0
2 0 0 0
vx/U
1 0 0 0
0
- 1 0 0 0
- 2 0 0 0
- 3 0 0 0
- 4 0 0 0
0
1
2
3
4
t/tk
5
6
x 1 0
-5
Figure 4 Time series of the Eulerian horizontal velocity in a point located 0.8H above the heat source.
3. DISPERSION PROPERTIES OF LAGRANGIAN TRACERS
The most natural framework for investigating transport phenomena is to adopt a Lagrangian viewpoint in
which the particles are advected by a given Eulerian velocity field, u(x, t) according to the equation:
dx
= u( x , t ) = v( t )
dt
(1)
where v(t) is the Lagrangian particle velocity, molecular diffusion is neglected and the incompressibility
constraint is assumed. Despite the apparent simplicity of this equation, the problem of relating the Eulerian
properties of u with the Lagrangian properties of the trajectories x(t) can not be considered a trivial task.
In the last decades, the discovering of the ubiquity of Lagrangian chaos has tuned this scenario even
more complex (Ottino, 1989). As a matter of fact very simple Eulerian fields can generate very complex
Lagrangian trajectories practically indistinguishable from those obtained in a turbulent flow. In a two
dimensional incompressible flow the emergence of Lagrangian chaos can be explained in terms of
dynamical system approach to the solution of (1). The equations describing these flows formally represent
a one degree of freedom Hamiltonian system
dx( t ) ∂ ψ ( x, y , t )
=
;
dt
∂y
dy( t )
∂ψ ( x , y , t )
=−
dt
∂x
(2)
where the Hamiltonian is the stream function ψ. If the flow is steady, the system (2) is trivially integrable
and all the solutions are regular (i.e. non-chaotic). For unsteady flows equations (2) are generally
nonintegrable and at least some of the solutions are expected to be chaotic.
The possibility of understanding the different nature of particle trajectories gives an insight into the
efficiency with which passive tracers are mixed by the flow. If we refer to advective and diffusive transport
of tracers as stirring and mixing respectively (Brown and Smith, 1991) we can observe that under chaotic
conditions the tracer is efficiently stirred which in turn causes an efficient mixing.
3.1 Lagrangian statistics
PTV technique measures the position and the velocity (2 component on a plane or on a volume) of the
seeding particles in each acquired frame i.e. in a Lagrangian framework. Dispersion of a passive tracer in a
given flow is consequently quantified by evaluating the statistical moments of these quantities. In
particular different mechanisms driving dispersion phenomena can be analyzed by looking at one particle-
5
two times statistics (absolute dispersion), two particles-one time statistics (relative dispersion), two
particle statistics at fixed scale (Finite Size Lyapunov Exponent).
If we consider the motion of a cloud of N particles xi i=1,…..N advected in a domain of size L by a smooth
velocity field with characteristic length lu we respectively obtain:
i) the mean square particle displacement or absolute dispersion:
D( t ) = x( t ) − x( 0 )
2
(3)
where the averaged is taken over the set N;
ii) the mean square separation of particle pairs or relative dispersion:
R 2( t ) = x i ( t ) − x j ( t )
2
(4)
where the average is taken over the whole considered couples {i, j};
iii) the mean separation growth rate of initially close particles at scale δ or Finite Size Lyapunov Exponent
(FSLE):
λ (δ ) =
1
ln r
τ (δ )
(5)
where τ (δ ) represents the average doubling time at scale δ. It is introduced by defining a series of
thresholds δ (n) = rnδ(0) where δ(0) is the initial pair separation and r=cost>1. By measuring the time Ti it
takes for the separation Ri to grow from δ(0) to δ(i) and by performing the doubling time experiments over Np
particle pairs one gets the doubling time < τ (δ ) > by averaging (Artale et al., 1997).
It has to be noted that the term doubling time strictly refers to the threshold rate r=2.
By comparing the quantities introduced in i) and ii) it can be observed that, especially when flows in
bounded domains are considered, the relative dispersion can be more interesting than the absolute one
which results dominated by large scale flows. As a matter of fact, if we consider two trajectories x 1(t) and
x 2(t), the evolution of the separation R(t) = x 2(t)- x 1(t) is given by:
dR
= v 2 ( t ) − v 1 ( t ) = u (x 1 ( t ) + R( t ),t ) − u( x1 ( t ),t )
dt
(6)
and thus depends on the velocity difference at the scale R = |R|. It follows that the Eulerian velocity
components of typical scale much larger than R will not contribute to the evolution of R.
If we analyze the asymptotic behavior of (4) in a bounded domain of size L when the typical lengths of the
Eulerian velocity field are lu (smallest structures) and L0 (largest ) we gets the following scenario:
- at very small separation (<<lu) the velocity difference in (6) can be linearly expanded in R. In most timedependents flow this expansion revels in exponential growth of initially close trajectories (i.e. to
Lagrangian chaos):
ln R( t ) ≈ ln R( 0 ) + λt
(7)
where λ represents the Lagrangian Lyapunov exponent of the system (Ottino, 1989).
- for very long times and separation (>>L0) the two considered trajectories can be considered decorrelated
and a diffusive regime
R 2 ( t ) ≈ 2 Dt
(8)
6
is attained.
It has to be observed that in several realistic situations this behavior can not be observed, mostly when L
is of the same order of L0.
3.2 Finite Size Lyapunov Exponents
The Finite Size Lyapunov Exponents (FSLE) introduced in the previous section, represent a generalization
of the Lyapunov exponent to finite separations (Aurell et al., 1997) developed by realizing that the
separation R between trajectories is nothing but the scale at which the system is observed. This means
that by keeping R finite, the FSLE allows to quantify the dispersion properties of the flow at different
length-scales. The evaluation of λ ( R ) in a bounded domain of size L achieved by the evaluation of the
separation doubling time (5), shows the following scale-dependant scenario:
if R << lu
λ
λ( R ) ~
D / R 2 if R >> lu
(9)
We can thus remark that:
(i) for small separation (lu<<L), if the Lagrangian dynamics is chaotic i.e. we recover the standard
Lagrangian Lyapunov exponent;
(ii) in the intermediate regime l< R <L, two particles are advected by almost uncorrelated velocities and
therefore a diffusive behaviour is expected. This implies that the scaling behavior of the FSLE is
λ (R ) ∼ D / R 2 where D is the diffusion coefficient;
(iii) at very large separation, R ∼L, λ(R) should go to zero because particles cannot separate more than the
domain size. For a large class of systems a universal behavior has been found (Artale et al., 1997)
λ( R ) =
D( R )
R
2
≈
1 ( R max − R )
τr
R
(10)
where R max =O(L) is the saturation value of R at the boundary which corresponds to having reached an
uniform distribution of the tracer in the basin, being τr dimensionally a time. Equation (10) can be obtained
by assuming that particle distribution relaxes exponentially (being τr the relaxation time) to the uniform
distribution (Artale et. al. 1997).
4. RESULTS AND DISCUSSION
As discussed, the convective flow analyzed in this experiment maintains essentially two-dimensional and
time dependent in the investigated range of Rayleigh number values. Therefore we expect chaotic
Lagrangian motion (Ottino, 1989). We have used the FSLE analysis on the experimental trajectories in
order to investigate the separation growth at different scales from the Lyapunov exponential regime up to
the saturation regime.
The FSLE analysis on the experimental data has been done as follows. After having fixed a set of
thresholds R n = R0 rn ( n = 0 ,.....N ) , for each time t0 a new couple is considered whenever we find two
R( t0 ) ≤ R 0 . The separation growth between these
particles is then followed for times t>t0 and the doubling times Tr ( Rn ) ,at scale Rn , are evaluated by
measuring the times the separation takes to grow from R n up to R n+ 1 = rR n . Since trajectories are sampled
at discrete times, the average over for computing λ ( R ) is done by extending (5) to the time-discrete case
using:
particles (not yet forming a couple) at distance
7
λ (δ ) =
( )
R Tρ
1
ln
T (R n ) Rn
(11)
In order to increase the statistics at large separations R, we computed the FSLE for different values of the
smallest scale R0 = 0.067H , 0. 1H , 0. 13H . The threshold rate r is equal to 1.2 in each computation.
Figure 5 and 6 show the FSLE computed for two different Rayleigh numbers (Ra=2.39⋅10 8 , Ra=96⋅10 8).
At small values of R, we observe a collapse of λ ( R ) to the plateau indicating the Lyapunov exponent
which is found to be positive (λ > 0 ). This gives a direct evidence of Lagrangian chaos in the
investigated flow (Boffetta et al., 1999). For larger separation, λ ( R ) drops to smaller values, indicating a
decreasing in the separation growth well described by the saturation regime. The collapse of the curves at
different R0 confirms that high statistics are reached even at large scales. The characteristic Eulerian scale
of smallest structures lu=0.5H can be estimated by the end of the exponential regime (i.e. the plateau
λ ( R ) ≈ λ ) after which the non linear effects start to dominate. From the discussion of the previous
section, we do not expect to observe the intermediate diffusive regime since in this case L0~Lu. The
saturation scale Rmax ≈ 1.9 H , and the relaxation time τ r ≅ 8.0 ⋅ 10− 4 tκ have been estimated too. We
observe that both 1 λ which gives an estimation of the small scale mixing time, and τ r are smaller than
the diffusive time tκ . This indicates that dispersion of Lagrangian tracers in the analyzed flow is not
driven by diffusion.
By performing the FSLE analysis for different Rayleigh numbers (Table I) we investigate the dependence
of the Lagrangian Lyapunov exponent on Ra. Figure 7 shows a clear scaling which indicaties a power law
dependence:
λ ~ Ra γ
(12)
with γ = 0.51 ± 0.02 . An analogous scaling has been observed for the Eulerian characteristic times in a
similar flow (Miozzi et al., 1998).
λ (R/H)t
k
10 3
1 0 -1
(R/H)
1 00
Figure 5 FSLE vs R (Ra= 2.39 ⋅ 10 8 ) for different initial thresholds.
8
λ (R/H)t k
10 3
1 0 -1
1 00
R/H
Figure 6 FSLE vs R (Ra= 5.96⋅10 8 ) for different initial thresholds.
4
10
λ t
k
3
10
8
10
9
Ra
10
Figure 7 Lagrangian Lyapunov exponents vs Ra.
In order to compare the FSLE and the relative dispersion analysis, we have computed the moments of
relative dispersion for Ra=2.39⋅10 8. The result, plotted in Figure 8, indicates that at small times (i.e. small
separation) an exponential regime characterised by a slope which increases with the moment order, p. The
reason for this behavior is that many pairs remain very close for very long times before being exponentially
separated.
As a further analysis we evaluate the probability distribution function of the pair distance for different
times plotted in Figure 9. As it is clearly shown in the Figure, most of the couples, representing the peak of
the distribution, remain close for long time. Moreover, for times longer that the circulation time, some of
the separated particles come close again causing strong fluctuations in the relative dispersion at large
times (see Figure 8). As a consequence, the saturation regime is not observable with this kind of analysis.
Both these problems do not affect the FSLE analysis because in this case statistics are performed only on
the set of pairs which effectively separate.
Let us end this section with some comments on the evaluation of the absolute dispersion (3). In Figure 10,
the mean square particle displacement versus time is plotted for different value of Rayleigh number. It is
possible to observe that, as expected, dispersion increase with Rayleigh number following a parabolic law
and that after a characteristic time (length) a saturation regime is attained.
As a matter of fact in this case this quantity only gives an indication of the mean spreading of the particles
from their initial condition without allowing neither interesting information about the spreading
mechanisms nor a suitable quantification of dispersion phenomena since contribution from different
structures at different times are included in the same average. This consideration can be extended to all
9
systems in which the characteristic length-scales are not sharply separated and consequently dispersion
can not be well described by using asymptotic quantities (Artale et al., 1997).
0.65
0.45
p 1/p
< R ( t )> / H
0.25
0.05
0
0.5
1
1.5
t / tk
x 10
-3
Figure 8 Rescaled relative dispersion <R(t) p >1/p for p=1,2,4 (from bottom to top) in lin-log plot.
10
10
1
0
p(R/H)
10
10
10
-1
-2
-3
0
0.1
0.2
0.3
0.4
0.5
0.6
R/H
Figure 9 Probability distribution function of pair separation at times t=2.510-4tk (solid line)
t=5.010-4tκ (dashed line) t=1.010-3tκ (dotted line) in lin-log plot.
10
-2
Ra
10
10
2
1.0 10
2.4 10
5.9 10
7.2 10
-3
8
8
8
8
-4
2
< d > (m )
10
10
10
2
-5
-6
-7
10
-1
10
0
1
10
t (s)
10
2
10
3
Figure 10 Mean square particle displacements vs time at different Ra.
10
ACKNOWLEDGEMENTS
The authors whish to tank A. Cenedese, G.P. Romano, G.Boffetta, M. Cencini, A. Vulpiani, M.Miozzi for
useful discussions and M. Tardia for his contributions during the data acquisition. This work is partially
supported by MURST (contract N. 9908264583).
REFERENCES
Adrian R.J., Particle-imaging techniques for experimental fluid mechanics, Ann. Rev. Fluid Mech. 23, 261
(1991).
Aref H., Integrable, chaotic, and turbulent vortex motions in two dimensional flows, Ann. Rev. Fluid
Mech., 15 (1983) 345; Stirring by chaotic advection, J. Fluid Mech. 143 (1984).
Artale V., Boffetta G., Celani A., Cencini M., Vulpiani A., Dispersion of passive tracers in closed basins:
Beyond the diffusion coefficient, Phys. Fluids A9 (1997), 3162.
Aurell, E. Boffetta, G. Crisanti, Paladin, G. Vulpiani, A. Predictability in the large: an exestion of the concept
of Lyapunov exponent. J. Phis. A30, 1 (1997).
Brown, M.G. Smith, K.B., B.J, Ocean stirring and chaotic low-order dynamics. Phis. Fluids. A 3, 1186 (1991)
Boffetta G., Celani A., Crisanti A., Vulpiani A., Relative dispersion in fully developed turbulence:
Lagrangian statistics in sinthetic flows, Europhys. Letters 42 (1999), 177.
Crisanti A., Falcioni M., Paladin G., Vulpiani A., Lagrangian chaos: Transport Mixing and Diffusion in
Fluids, LaRivista del Nuovo Cimento, 14, 1 (1991)
Desrayaud G., Lauriat G., Unsteady confined buoyant plumes, J. Fluid Mech. 252 (1993), 617.
Koschmieder, E.I., Bénard cells and Taylor Vortices, Cambridge Univ. Press (1993).
Miozzi M., Querzoli G., Determinazione dell’andamento temporale di un campo di vorticità mediante
l’analisi di immagine, Atti del XXV Convegno di Idraulica e Costruzioni Idrauliche 3, (1996), 484.
Miozzi ., Querzoli G., Romano G.P., The investigation of an unstable convective flow using optical
methods, Phys. Fluids 10 (1998), 2995.
Monin A., Yaglom A., Statistical Fluid Dynamics, MIT Press, Cambridge, 1983.
Ottino J.M, The Kinematics of Mixing: Stretching, Chaos and Transport, Cambridge University Press,
Cambridge, 1989.
Querzoli G., A Lagrangian study of particle dispersion in the unstable boundary layer, Atmos. Env., 16,
2821 (1996).
Solomon T.H., Gollub J.P., Chaotic particle transport in time-dependent Rayleigh-Bnard convection. Phys.
Rew. A 38 (1998), 6280.
Taylor G.I., Diffusion by continuous movements, Proc. London Math. Soc. 20 (1921), 196.
11
