A short term study on ... phytoplankton biomass and nutrients in ... pelagic zone in Lake Tanganyika
advertisement
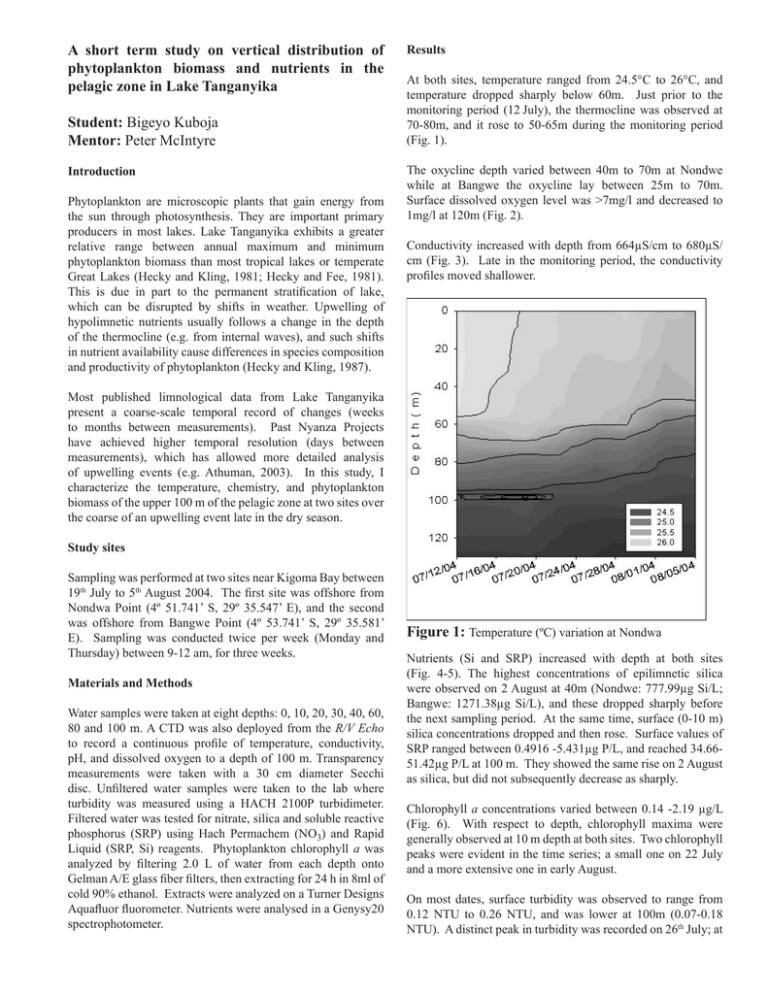
A short term study on vertical distribution of phytoplankton biomass and nutrients in the pelagic zone in Lake Tanganyika Student: Bigeyo Kuboja Mentor: Peter McIntyre Introduction Phytoplankton are microscopic plants that gain energy from the sun through photosynthesis. They are important primary producers in most lakes. Lake Tanganyika exhibits a greater relative range between annual maximum and minimum phytoplankton biomass than most tropical lakes or temperate Great Lakes (Hecky and Kling, 1981; Hecky and Fee, 1981). This is due in part to the permanent stratification of lake, which can be disrupted by shifts in weather. Upwelling of hypolimnetic nutrients usually follows a change in the depth of the thermocline (e.g. from internal waves), and such shifts in nutrient availability cause differences in species composition and productivity of phytoplankton (Hecky and Kling, 1987). Results At both sites, temperature ranged from 24.5°C to 26°C, and temperature dropped sharply below 60m. Just prior to the monitoring period (12 July), the thermocline was observed at 70-80m, and it rose to 50-65m during the monitoring period (Fig. 1). The oxycline depth varied between 40m to 70m at Nondwe while at Bangwe the oxycline lay between 25m to 70m. Surface dissolved oxygen level was >7mg/l and decreased to 1mg/l at 120m (Fig. 2). Conductivity increased with depth from 664µS/cm to 680µS/ cm (Fig. 3). Late in the monitoring period, the conductivity profiles moved shallower. Most published limnological data from Lake Tanganyika present a coarse-scale temporal record of changes (weeks to months between measurements). Past Nyanza Projects have achieved higher temporal resolution (days between measurements), which has allowed more detailed analysis of upwelling events (e.g. Athuman, 2003). In this study, I characterize the temperature, chemistry, and phytoplankton biomass of the upper 100 m of the pelagic zone at two sites over the coarse of an upwelling event late in the dry season. Study sites Sampling was performed at two sites near Kigoma Bay between 19th July to 5th August 2004. The first site was offshore from Nondwa Point (4º 51.741’ S, 29º 35.547’ E), and the second was offshore from Bangwe Point (4º 53.741’ S, 29º 35.581’ E). Sampling was conducted twice per week (Monday and Thursday) between 9-12 am, for three weeks. Materials and Methods Water samples were taken at eight depths: 0, 10, 20, 30, 40, 60, 80 and 100 m. A CTD was also deployed from the R/V Echo to record a continuous profile of temperature, conductivity, pH, and dissolved oxygen to a depth of 100 m. Transparency measurements were taken with a 30 cm diameter Secchi disc. Unfiltered water samples were taken to the lab where turbidity was measured using a HACH 2100P turbidimeter. Filtered water was tested for nitrate, silica and soluble reactive phosphorus (SRP) using Hach Permachem (NO3) and Rapid Liquid (SRP, Si) reagents. Phytoplankton chlorophyll a was analyzed by filtering 2.0 L of water from each depth onto Gelman A/E glass fiber filters, then extracting for 24 h in 8ml of cold 90% ethanol. Extracts were analyzed on a Turner Designs Aquafluor fluorometer. Nutrients were analysed in a Genysy20 spectrophotometer. Figure 1: Temperature (ºC) variation at Nondwa Nutrients (Si and SRP) increased with depth at both sites (Fig. 4-5). The highest concentrations of epilimnetic silica were observed on 2 August at 40m (Nondwe: 777.99µg Si/L; Bangwe: 1271.38µg Si/L), and these dropped sharply before the next sampling period. At the same time, surface (0-10 m) silica concentrations dropped and then rose. Surface values of SRP ranged between 0.4916 -5.431µg P/L, and reached 34.6651.42µg P/L at 100 m. They showed the same rise on 2 August as silica, but did not subsequently decrease as sharply. Chlorophyll a concentrations varied between 0.14 -2.19 µg/L (Fig. 6). With respect to depth, chlorophyll maxima were generally observed at 10 m depth at both sites. Two chlorophyll peaks were evident in the time series; a small one on 22 July and a more extensive one in early August. On most dates, surface turbidity was observed to range from 0.12 NTU to 0.26 NTU, and was lower at 100m (0.07-0.18 NTU). A distinct peak in turbidity was recorded on 26th July; at the two stations (F1, 93=0.31, p=0.557). Temporal variation between sampling dates was also significant (F5, 89=1519961.5, p<0.001). Depth-related patterns depended on the sampling date, as indicated by the interaction between depth and date (F5, =92.79, p<0.001). Multiple regression analyses of whether 89 nutrient concentrations predicted chlorophyll concentrations indicated no significant pattern, even when analyzed separately for each depth. Table 1 shows the correlation between the physical, chemical, and chlorophyll data. Discussion Figure 2: Dissolved oxygen (mg O/L) variation at Nondwa This study confirms the strong gradient in nutrient concentrations with depth documented in the literature and previous Nyanza Project studies. The large shift in the depth of the thermocline (from 70-80m to 50-60m) was probably caused by internal waves, and led to upwelling of hypolimnetic water. The upwelling was clearly shown by the synchronized changes in all chemical parameters (e.g. DO, conductivity, Si, SRP) at the surface, turbidity was 1.23 NTU at Nondwa and 1.33 NTU at Bangwe, and it reached 0.69 NTU at 100 m at both stations. Secchi transparency fluctuated between 7.7m and 16.7m, and showed similar patterns through time at both stations. The peak transparency was recorded on 29th July at both stations (Fig. 7). The two pelagic sampling stations indicated very similar patterns, hence the figures present data from only one station. There were small absolute differences in nutrients and chlorophyll a between the two stations, with Nondwe showing slightly higher concentrations at a given depth and time. The other difference was that the hypoxic waters rose higher, reaching ~25 m, at Bangwe on 2 August than at Nondwa. The statistical significance of spatial and temporal variation in chlorophyll a and nutrients (Si and SRP) were tested using repeated-measures ANOVAs. There were significantly differences among depths (F1, 93=120.23, p<0.0001) but not Figure 4: Silica (µg Si/L) variation at Nondwa both monitoring sites. At the same time, algal biomass peaked, and remained elevated for the remainder of the study period. The absolute concentrations reported in previous Nyanza studies were much higher than those reported in this study and the literature. For example, Merriam (2003) reported silica concentrations of 1100-3000µg Si/L and SRP of 0-2840µg P/L, which are 3x higher for Si and 50x higher for SRP than those presented in Figures 4-5 and those of Edmond et al. (1993). It is likely that the Hach Rapid Liquid reagent system offers more accurate results than the powder pillow systems used for previous Nyanza Project work. Figure 3: Conductivity (µS/cm) variation at Bangwe Chlorophyll a values (0.14-2.19µg/L) were comparable to past values in the literature (Salonen et al., 1999) and Nyanza reports (Haupert et al., 1998; Johannes et al., 1999; Baldwin, 2000). The peak in the vertical chlorophyll a concentration was found at 20m; the decrease above that depth is probably due to photoinhibition. Conclusions The duration of my sampling was sufficient to observe the upwelling, but a longer period would have been better. There was not enough data to draw detailed conclusions about the effects of nutrients on chlorophyll a. However, there was a clear association between nutrient concentrations and phytoplankton biomass following the upwelling event. Acknowledgments I wish to thank the Nyanza Project for financial support of this project. I would like to thank my mentor Peter McIntyre for his assistance and encouragement throughout the entire project. Special thanks to Willy Mbemba for his dedicated assistance in the field, lab and computer work. I would like to thank the CLIMFISH Project for sponsoring in part my training and research (funded by the Development Cooperation and Science Policy Office, Belgium). Sincere thanks go to Chatta and Chale for their assistance in fieldwork. I would like to thank the students, mentors and TA’s of Nyanza. Figure 5: SRP (µg P/L) variation at the Nondwa References Athuman, C. 2003. Physical parameters as indicators of upwelling in the pelagic zone of Lake Tanganyika. Nyanza Project annual report 2003: 68-72. Edmond J. M., Craig, H., Vraig, V., Weiss, R. F., Coulter, G. W., 1993. Nutrients chemistry of the water column of lake Tanganyika. Limnol. Oceanogr., 1993. 725-738. Hecky R. E. & Fee E. J., 1981. Primary production and rates of algae growth in Lake Tanganyika. Limnology and Oceanography 26(3): 532-547. Hecky R. E. & Kling H. J., 1981. The phytoplankton and the protozooplankton of the euphotic zone of Lake Tanganyika: Species composition biomass chlorophyll content and spatial-temporal distribution. Limnology and Oceanography 26(3): 548-564. Hecky R. E. & Kling H. J., 1987. Phytoplankton ecology of the Great Lakes in the rift valleys of Central Africa. Arch. Fur Hydr. Ergeb. Limnol. (Stuttgart) 25:197228. Wetzel, R. G. 1975. Limnology. Philadephia: W. B. Saunders Company Figure 6: Chlorophyll a (µg/L) variation at Nondwa Figure 7: Secchi transparency at both stations through time Table 1. Correlation matrix among the chemical, physical, and biological parameters. Cond DO Temp Chl a Si SRP Turbidity Cond x -0.9593 -0.9808 -0.6539 0.7774 0.9416 -0.1863 DO -0.9593 x 0.9659 0.6304 -0.8012 -0.9163 0.2153 Temp -0.9808 -0.6539 x 0.6570 -0.7651 -0.9471 0.1590 Chl a -0.6539 0.6304 0.6570 x -0.6023 -0.6618 0.0389 Si 0.7774 -0.8012 -0.9471 -0.6618 x 0.8413 -0.1593 SRP 0.9416 0.9416 -0.9417 -0.6618 0.8413 x -0.1741 Turbidity -0.1863 0.2190 0.1590 0.0389 -0.1593 -0.1741 x
