Homework 1
advertisement
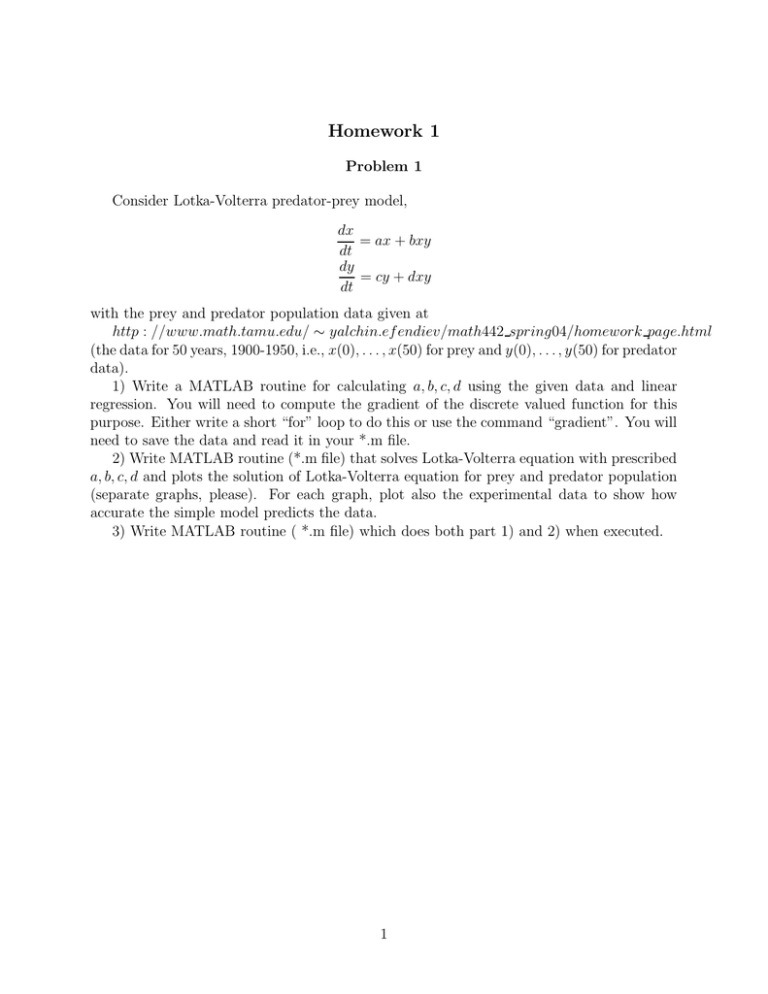
Homework 1 Problem 1 Consider Lotka-Volterra predator-prey model, dx = ax + bxy dt dy = cy + dxy dt with the prey and predator population data given at http : //www.math.tamu.edu/ ∼ yalchin.ef endiev/math442 spring04/homework page.html (the data for 50 years, 1900-1950, i.e., x(0), . . . , x(50) for prey and y(0), . . . , y(50) for predator data). 1) Write a MATLAB routine for calculating a, b, c, d using the given data and linear regression. You will need to compute the gradient of the discrete valued function for this purpose. Either write a short “for” loop to do this or use the command “gradient”. You will need to save the data and read it in your *.m file. 2) Write MATLAB routine (*.m file) that solves Lotka-Volterra equation with prescribed a, b, c, d and plots the solution of Lotka-Volterra equation for prey and predator population (separate graphs, please). For each graph, plot also the experimental data to show how accurate the simple model predicts the data. 3) Write MATLAB routine ( *.m file) which does both part 1) and 2) when executed. 1
