Document 10505593
advertisement
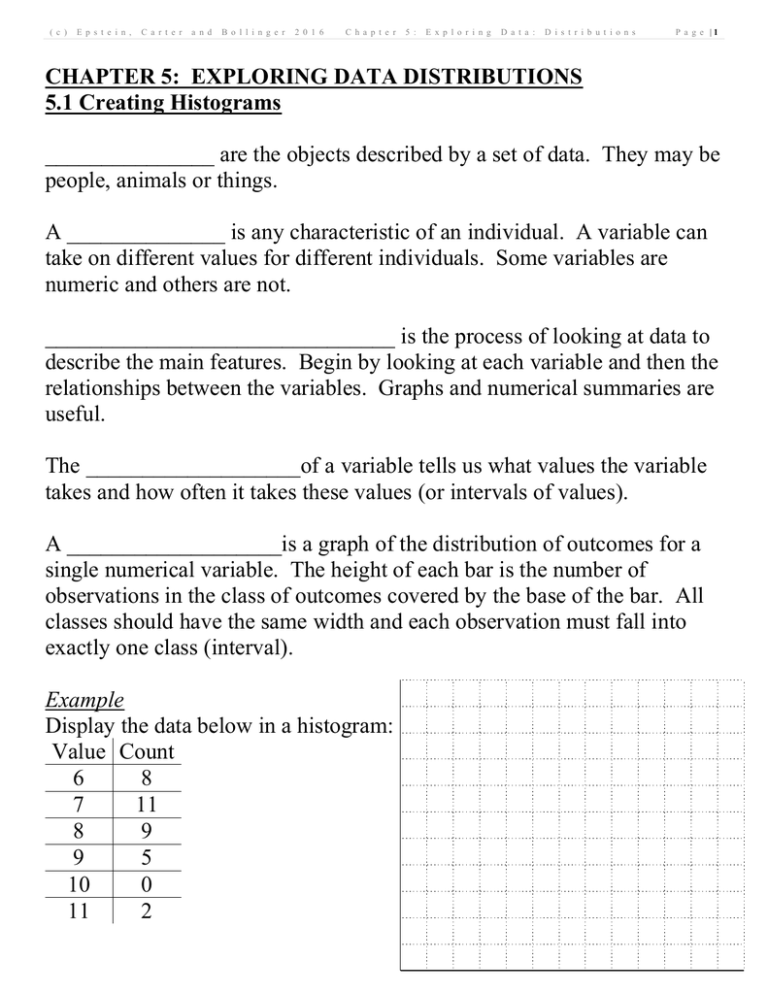
( c ) E p s t e i n , C a r t e r a n d B o l l i n g e r 2 0 1 6 C h a p t e r 5 : E x p l o r i n g D a t a : D i s t r i b u t i o n s P a g e |1 CHAPTER 5: EXPLORING DATA DISTRIBUTIONS 5.1 Creating Histograms _______________ are the objects described by a set of data. They may be people, animals or things. A ______________ is any characteristic of an individual. A variable can take on different values for different individuals. Some variables are numeric and others are not. _______________________________ is the process of looking at data to describe the main features. Begin by looking at each variable and then the relationships between the variables. Graphs and numerical summaries are useful. The ___________________of a variable tells us what values the variable takes and how often it takes these values (or intervals of values). A ___________________is a graph of the distribution of outcomes for a single numerical variable. The height of each bar is the number of observations in the class of outcomes covered by the base of the bar. All classes should have the same width and each observation must fall into exactly one class (interval). Example Display the data below in a histogram: Value Count 6 8 7 11 8 9 9 5 10 0 11 2 ( c ) E p s t e i n , C a r t e r a n d B o l l i n g e r 2 0 1 6 C h a p t e r 5 : E x p l o r i n g D a t a : D i s t r i b u t i o n s P a g e |2 Histogram Bin Width 56, 63, 65, 66, 70, 71, 74, 75, 75, 76, 76, 79, 80, 80, 81, 82, 82, 85, 87, 90, 90, 90, 91, 92, 93, 93, 94, 96, 97, 98, 98, 103, 104, 104, 105, 109, 110, 115, 127, 132 1 Bin 2 Bins 3 Bins 4 Bins 5 Bins 6 Bins 7 Bins 8 Bins 9 Bins 10 Bins 15 Bins 20 Bins 30 Bins 40 Bins ( c ) E p s t e i n , C a r t e r a n d B o l l i n g e r 2 0 1 6 C h a p t e r 5 : E x p l o r i n g D a t a : D i s t r i b u t i o n s P a g e |3 Steps to Creating a Histogram: 1. Choose the classes. Divide the range of the data into a “reasonable” number of classes of equal width. 2. Count the number of individuals in each class (frequency). 3. Draw the histogram. The vertical axis is the count in each class. The horizontal axis represents the classes. Example The following data is the recorded daily high temperature (in °F) in College Station for March 2006. Display this data in a histogram. 86 86 85 83 83 82 82 81 81 80 79 77 77 77 76 76 75 74 74 73 72 72 72 69 69 69 67 65 61 58 51 Classes (Size: ) Frequency ( c ) E p s t e i n , C a r t e r a n d B o l l i n g e r 2 0 1 6 C h a p t e r 5 : E x p l o r i n g D a t a : D i s t r i b u t i o n s P a g e |4 5.2 Interpreting Histograms In any graph of data, look for patterns and deviations from the patterns. Ask yourself questions such as: Does the graph have one or more peaks? Is the graph symmetric or skewed? Are there outliers? Where is the center? Is most of the data spread out or close together? A graph is ______________________ if the right and left sides of the histogram are approximately mirror images of each other. A graph is ________________________ if the longer tail is on the right side. This is also called ____________________ skewed. A graph is ________________________ if the longer tail is on the left side. This is also called ____________________ skewed. An______________ is an individual data value that falls outside the overall pattern. ( c ) E p s t e i n , C a r t e r a n d B o l l i n g e r 2 0 1 6 C h a p t e r 5 : E x p l o r i n g Example Comment on the shapes of the histograms below: D a t a : D i s t r i b u t i o n s P a g e |5 ( c ) E p s t e i n , C a r t e r a n d B o l l i n g e r 2 0 1 6 C h a p t e r 5 : E x p l o r i n g D a t a : D i s t r i b u t i o n s P a g e |6 5.3 Creating Stemplots A _____________ is a display of the distribution of a variable that attaches the final digits of the observations as leaves on stems made up of all but the final digit. To Make A Stemplot: 1. Separate each observation into a stem (consisting of all but the rightmost digit) and a leaf (the rightmost digit). 2. Write the stems in a vertical column with the smallest at the top. Include all the stem values from smallest to largest, even if some are not used. Draw a vertical line at the right of this column. 3. Write each leaf in the row to the right of its stem in increasing order. 4. Provide a key. Example Display the following data in a stemplot: 2 5 7 9 11 15 16 18 18 29 34 35 37 39 40 43 44 45 23 45 23 57 25 25 70 28 29 ( c ) E p s t e i n , C a r t e r a n d B o l l i n g e r 2 0 1 6 C h a p t e r 5 : E x p l o r i n g D a t a : D i s t r i b u t i o n s Example Round the following data to the nearest 10, drop the ending zero and display the result in a stemplot. 118 122 160 161 203 210 216 247 250 266 301 302 304 313 316 321 328 333 334 335 349 393 403 411 605 1111 P a g e |7 ( c ) E p s t e i n , C a r t e r a n d B o l l i n g e r 2 0 1 6 C h a p t e r 5 : E x p l o r i n g D a t a : D i s t r i b u t i o n s P a g e |8 5.4 Describing Center: Mean and Median ̅, of a set of observations, add their values and To find the _______, 𝒙 divide by the number of observations. If the n observations are x1, x2, …, xn then 𝑥̅ = 𝑥1 + 𝑥2 + ⋯ + 𝑥𝑛 𝑛 To find the ____________, M, of a set of observations, 1. **Arrange all the observations in increasing order.** 2. If the number of observations is odd, the median is the observation in the center of the ordered list. 3. If the number of observations is even, the median is the mean of the two center observations in the ordered list. The __________ of a set of observations is the observation that occurs the most frequently. You can have no mode or, if there is a tie, you can have multiple modes. All of these measurements will have the same units as the data values. ( c ) E p s t e i n , C a r t e r a n d B o l l i n g e r 2 0 1 6 C h a p t e r 5 : E x p l o r i n g D a t a : D i s t r i b u t i o n s P a g e |9 Example The following are scores on an honors exam from a class of 17 students: 32, 71, 72, 77, 77, 83, 84, 85, 87, 89, 90, 92, 95, 96, 98, 99, 100 What is the “average” score on the honors exam? Are there any outliers? If so, if they are removed, how will that affect the “average” scores? ( c ) E p s t e i n , C a r t e r a n d B o l l i n g e r 2 0 1 6 C h a p t e r 5 : E x p l o r i n g D a t a : D i s t r i b u t i o n s P a g e | 10 5.5 Describing Spread: The Quartiles The _________________ is a measure of spread of a set of observations. It is obtained by subtracting the smallest observation (minimum) from the largest (maximum). The median cuts the data into two groups…half of the data is below the median and half is above the median. Quartiles cut the data into four groups. The median is also called the second quartile, Q2. A fourth of the data is below the first quartile, Q1. Q1 is the median of the data below Q2. A fourth of the data is above the third quartile, Q3. Q3 is the median of the data above Q2. The interquartile range (or IQR) is Q3 - Q1 Min Q1 M = Q2 Q3 Max Example The following are scores on an honors exam from a class of 17 students: 32, 71, 72, 77, 77, 83, 84, 85, 87, 89, 90, 92, 95, 96, 98, 99, 100 What is the minimum score? ________ Maximum score? ________ What is the range of scores? _______________________________ What is Q1? _______ What is Q2?________ What is Q3? ________ What is the IQR? _____________________ ( c ) E p s t e i n , C a r t e r a n d B o l l i n g e r 2 0 1 6 C h a p t e r 5 : E x p l o r i n g D a t a : D i s t r i b u t i o n s P a g e | 11 Example The following data is the recorded daily high temperature (in °F) in College Station for March 2006. 86, 86, 85, 83, 83, 82, 82, 81, 81, 80, 79, 77, 77, 77, 76, 76, 75, 74, 74, 73, 72, 72, 72, 69, 69, 69, 67, 65, 61, 58, 51 Find the following for the given data: Min: _______ Max: ________ Range: ___________________ Mean: Median: ___________ Mode: ____________ Q1: _________ Q2: _________ Q3: ____________ IQR: _______________________________________ Reminder: The numbers given in these examples were already placed in numerical order. If your data is not given to you in numerical order, you must first put the data in numerical order before calculating the median and the quartiles. Example If the mean, median and mode of the salary of all cultural geography graduates from UNC are given, how will these be changed (if at all) knowing that Michael Jordan is amongst these graduates? What effect will this have on the histogram? ( c ) E p s t e i n , C a r t e r a n d B o l l i n g e r 2 0 1 6 C h a p t e r 5 : E x p l o r i n g D a t a : D i s t r i b u t i o n s P a g e | 12 5.6 The Five-Number Summary and Boxplots The ______________________ of a distribution consists of the following: Minimum Q1 Median Q3 Maximum A ____________ is a graph of the five-number summary, Example Display the exam scores and high temperatures (from previous examples) in a boxplot. Scores: Temps: One definition of an outlier is a data value that is either less than 𝑄1 – 1.5 ∙ 𝐼𝑄𝑅 or greater than 𝑄3 + 1.5 ∙ 𝐼𝑄𝑅. Are there outliers in the exam grades? ( c ) E p s t e i n , C a r t e r a n d B o l l i n g e r 2 0 1 6 C h a p t e r 5 : E x p l o r i n g D a t a : D i s t r i b u t i o n s P a g e | 13 Example The CDC reports that the number of new AIDS cases per year from 1990 to 2004 in Iowa are: 75, 118, 156, 104, 110, 104, 97, 76, 60, 78, 79, 80, 75, 76, 69 Show this data in a boxplot, with labels. Are there outliers? Example The CDC reports that the number of new Lyme disease cases per year from 1990 to 2004 in Iowa are: 16, 22, 33, 8, 17, 16, 19, 8, 27, 24, 34, 54, 65, 72, 49, 88 Show this data in a boxplot, with labels. Are there any outliers? Example Six numbers have min=5, max=19, mode=17 and med=16. Find a possible data set for these results. ( c ) E p s t e i n , C a r t e r a n d B o l l i n g e r 2 0 1 6 C h a p t e r 5 : E x p l o r i n g D a t a : 5.7 Describing Spread: The Standard Deviation 3, 3, 3, 3, 3 2, 2, 3, 4, 4 D i s t r i b u t i o n s P a g e | 14 0, 0, 5, 5, 5 Mean=3, Std. Dev = 0 Mean=3, Std. Dev =1 Mean = 3, Std. Dev=2.7 On “average”, how far away are the measurements from the mean? The standard deviation answers this question. Example The table to the right gives the average monthly temperature (in °F) of two different cities for four different months. Find the mean temperature and standard deviation for each city, and determine which city’s temperature varies the most. Jan Apr Jul Oct San Diego San Diego 65 68 76 75 x Chicago 29 59 84 64 65 68 76 75 Chicago x 29 59 84 64 The formula for standard deviation, s, is: (𝑥1 − 𝑥̅ )2 + (𝑥2 − 𝑥̅ )2 + ⋯ + (𝑥𝑛 − 𝑥̅ )2 𝑠 = √𝑣𝑎𝑟𝑖𝑎𝑛𝑐𝑒 = √ 𝑛−1 ( c ) E p s t e i n , C a r t e r a n d B o l l i n g e r 2 0 1 6 C h a p t e r 5 : E x p l o r i n g D a t a : D i s t r i b u t i o n s P a g e | 15 5.8 Normal Distributions When you have data for a single numerical variable you should… 1. Graph the data as a histogram, stemplot or dotplot. 2. Look at the shape, center and spread of the graph. 3. Calculate numerical summary numbers such as the five-number summary or the mean and standard deviation. 4. Is the distribution so regular that it could be described by a smooth curve? If so, is the curve bell shaped? One hundred fair coins were flipped and the number of heads was counted. This experiment was repeated 114 times and the results are shown in the histogram below. How many times were 45 or fewer heads observed? What proportion of the time were 45 or fewer heads observed? What proportion of the time were more than 50 heads observed? ( c ) E p s t e i n , C a r t e r a n d B o l l i n g e r 2 0 1 6 C h a p t e r 5 : E x p l o r i n g D a t a : D i s t r i b u t i o n s P a g e | 16 Can we approximate this with a bell curve? The data has a mean of 50.28 heads and a standard deviation of 5.1 heads. This generates a bell curve with the shape as shown. 12 10 8 6 4 2 0 30 32 34 36 38 40 42 44 46 48 50 52 54 56 58 60 62 64 66 68 70 Can we use the smooth curve to find the probabilities? Some general information about bell curves. 1. Referred to as the NORMAL CURVE or NORMAL DIST. 2. The location of the peak depends on where the mean is located. Typically use the symbol µ (mu) for the mean of the distribution. -3 -2 -1 0 1 3. The curve is symmetric about the mean. 2 3 ( c ) E p s t e i n , C a r t e r a n d B o l l i n g e r 2 0 1 6 C h a p t e r 5 : E x p l o r i n g D a t a : D i s t r i b u t i o n s P a g e | 17 4. The spread is determined by the standard deviation. Typically use the symbol σ (sigma) for the standard deviation of the distribution. A B C -3 -2 -1 0 1 2 3 To find when you are one standard deviation away from the mean, look for where the curvature changes. -2 -1 0 1 2 The normal curve with a mean of 0 and a standard deviation of 1 is known as the standard normal curve. For all normal curves, the first quartile is located about 0.67 standard deviations below the mean and the third quartile is located about 0.67 standard deviations above the mean. Example Where are the first and third quartiles located on (a) the standard normal curve? (b) the normal curve with 𝜇 = 10, 𝜎 = 2 ? ( c ) E p s t e i n , C a r t e r a n d B o l l i n g e r 2 0 1 6 C h a p t e r 5 : E x p l o r i n g D a t a : D i s t r i b u t i o n s P a g e | 18 Example A certain type of washing machines has a useful life with a mean of 12 years and a standard deviation of 2 years. (a) Draw a normal curve with the mean and standard deviation located correctly. _________________________ (b) If a washing machine lasts 10 years, how many standard deviations below the mean is that washing machine? What if it lasted 15 years? The standard score (or_____________) of a measurement X is how many standard deviations (σ) the measurement is away from the mean (µ). To calculate the standard score, Z, or to find X with a given Z value, use the formula Z X or X Z Example A normal distribution has a mean of 50 and a standard deviation of 8. (a) Find the z-scores for the following values of X: X = 42, Z = X = 38, Z = X = 60, Z = (b) If the z-score of a measurement is 1.5, what is the value of X? ( c ) E p s t e i n , C a r t e r a n d B o l l i n g e r 2 0 1 6 C h a p t e r 5 : E x p l o r i n g D a t a : D i s t r i b u t i o n s P a g e | 19 5.9 The 68-95-99.7 Rule In any normal distribution, About 68% of the data is within one standard deviation of the mean About 95% of the data is within 2 standard deviations of the mean About 99.7% of the data is within 3 standard deviations of the mean. Example The length of tape on a roll of a certain type of masking tape is normally distributed with a mean of 25 meters and a standard deviation of 50 centimeters. (a) What is the range of lengths of most (99.7%) of the rolls? (b) What percent of the rolls are longer than 26 meters? (c) What lengths bracket the middle 50% of the rolls of tape? ( c ) E p s t e i n , C a r t e r a n d B o l l i n g e r 2 0 1 6 C h a p t e r 5 : E x p l o r i n g D a t a : D i s t r i b u t i o n s P a g e | 20 Example A class of 1000 students will be graded based on the normal curve with A grade of “A” assigned to students who are more than two standard deviations above the mean. A grade of “B” assigned to students who are between 1 and 2 standard deviations above the mean. A grade of “C” assigned to the students within one standard deviation of the mean. A grade of “D” assigned to students between 1 and 2 standard deviations below the mean. A grade of “F” assigned to students more than two standard deviations below the mean. How many students receive each grade? If the mean grade in the class is 76, with a standard deviation of 12, what are the grade cut-offs?
