( ) g k
advertisement
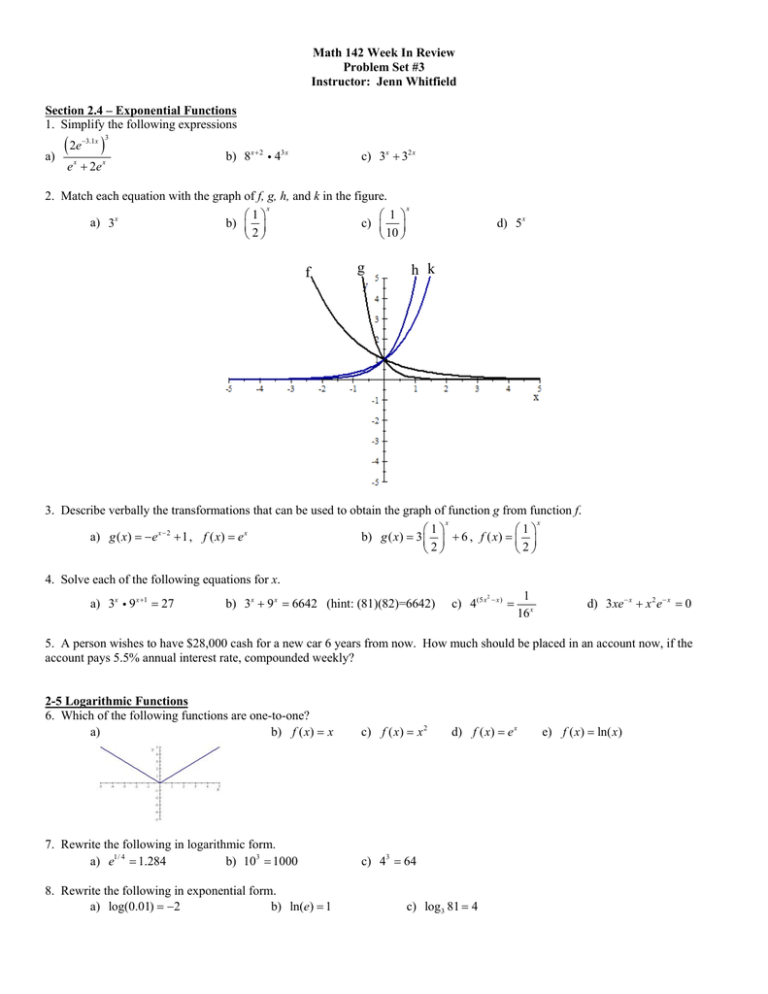
Math 142 Week In Review Problem Set #3 Instructor: Jenn Whitfield Section 2.4 – Exponential Functions 1. Simplify the following expressions ( 2e ) −3.1 x a) 3 e x + 2e x b) 8x + 2 i 43 x c) 3x + 32 x 2. Match each equation with the graph of f, g, h, and k in the figure. x x ⎛1⎞ ⎛ 1 ⎞ a) 3x b) ⎜ ⎟ c) ⎜ ⎟ ⎝2⎠ ⎝ 10 ⎠ f g d) 5 x h k 3. Describe verbally the transformations that can be used to obtain the graph of function g from function f. x x ⎛1⎞ ⎛1⎞ a) g ( x) = −e x − 2 + 1 , f ( x) = e x b) g ( x) = 3 ⎜ ⎟ + 6 , f ( x) = ⎜ ⎟ ⎝2⎠ ⎝2⎠ 4. Solve each of the following equations for x. a) 3x i 9 x+1 = 27 b) 3x + 9 x = 6642 (hint: (81)(82)=6642) c) 4(5 x 2 − x) = 1 16 x d) 3xe − x + x 2 e − x = 0 5. A person wishes to have $28,000 cash for a new car 6 years from now. How much should be placed in an account now, if the account pays 5.5% annual interest rate, compounded weekly? 2-5 Logarithmic Functions 6. Which of the following functions are one-to-one? a) b) f ( x) = x c) f ( x) = x 2 7. Rewrite the following in logarithmic form. a) e1/ 4 = 1.284 b) 103 = 1000 c) 43 = 64 8. Rewrite the following in exponential form. a) log(0.01) = −2 b) ln(e) = 1 d) f ( x) = e x c) log 3 81 = 4 e) f ( x) = ln( x) 9. Find the domain of the following functions. a) f ( x) = log 5 ( x − 3) b) g ( x) = ln( x 2 − 9) 10. Solve the following equations for x. a) 5 i 4 x = 65 b) 3 + log 2 x = 8 c) log 2 ( x + 6) + log 2 ( x) = 4 d) log 7 (log 3 (2 x + 1) + 45) = 2 11. Given log b (5) = 2.3219 and log b (7) = 2.8074 find: ⎛ 49 ⎞ b) log b ⎜ 2 ⎟ ⎝ 5b ⎠ a) log b (175b3 ) 12. a) If f ( x) = log( x + 2) find f −1 ( x) . b) If g ( x) = 2e x find g −1 ( x) . 13. In its first 10 years a mutual fund produced an average annual return of 20.06%. Assume that money invested in this fund continues to earn 20.06% compounded annually. How long will it take money invested in this fund to double? 14. Prehistoric cave paintings were discovered in a cave in France. The paint contained 3% of the original carbon-14. Use the exponential decay model for carbon-14, A = A0 e −0.000121t , to estimate the age of the paintings. Modeling using Regression 15. The table below represents the millions of Americans covered by private or government health insurance from 1987 to 1997. Year 1987 1989 1991 1993 1995 1997 Americans 241 246 251 260 264 269 Covered (in millions) a) Standardize the data by letting x represent the number of years since 1985. Then use regression to determine whether the linear, cubic, or logarithmic function is the best fitting model if we want to predict how many Americans will be covered by private or government health insurance in 2010. b) Would the best fitting model change if we wanted to know the number of Americans covered by private or government health insurance in 1990? Why or why not?
