GCSE Mathematics Extension Material NA 11 Plotting curves Task: Parametric equations
advertisement
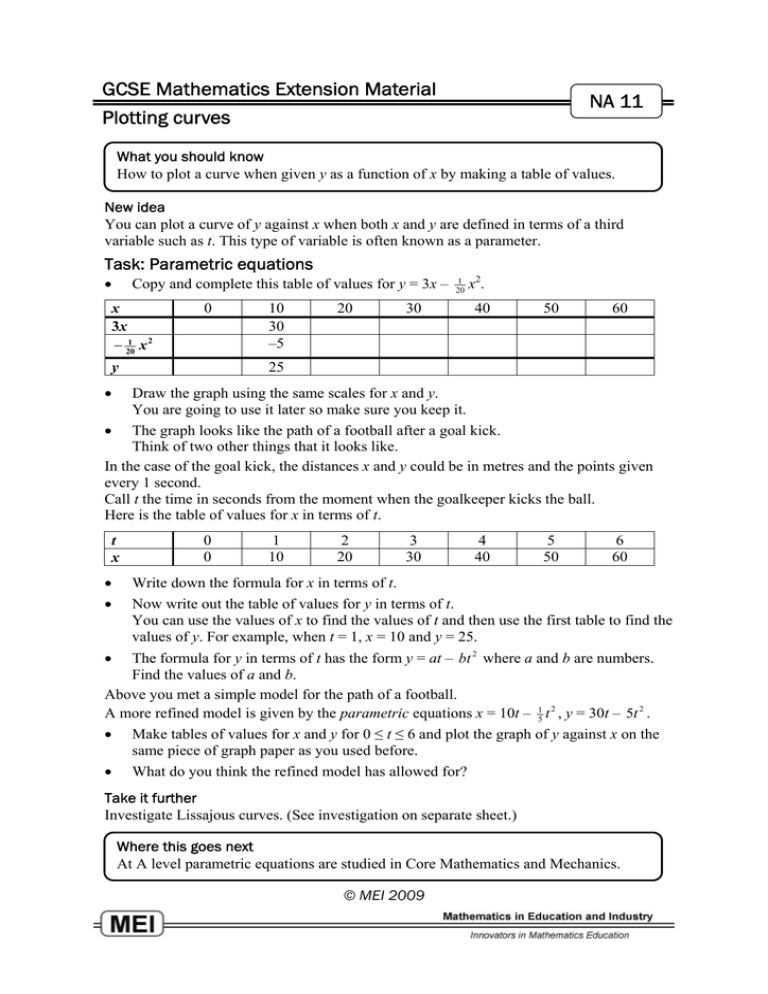
GCSE Mathematics Extension Material NA 11 Plotting curves What you should know How to plot a curve when given y as a function of x by making a table of values. New idea You can plot a curve of y against x when both x and y are defined in terms of a third variable such as t. This type of variable is often known as a parameter. Task: Parametric equations • Copy and complete this table of values for y = 3x – x 3x − 201 x 2 0 10 30 –5 20 30 1 20 x2. 40 50 60 25 y • Draw the graph using the same scales for x and y. You are going to use it later so make sure you keep it. • The graph looks like the path of a football after a goal kick. Think of two other things that it looks like. In the case of the goal kick, the distances x and y could be in metres and the points given every 1 second. Call t the time in seconds from the moment when the goalkeeper kicks the ball. Here is the table of values for x in terms of t. t x • • 0 0 1 10 2 20 3 30 4 40 5 50 6 60 Write down the formula for x in terms of t. Now write out the table of values for y in terms of t. You can use the values of x to find the values of t and then use the first table to find the values of y. For example, when t = 1, x = 10 and y = 25. • The formula for y in terms of t has the form y = at – bt 2 where a and b are numbers. Find the values of a and b. Above you met a simple model for the path of a football. A more refined model is given by the parametric equations x = 10t – 15 t 2 , y = 30t – 5t 2 . • Make tables of values for x and y for 0 ≤ t ≤ 6 and plot the graph of y against x on the same piece of graph paper as you used before. • What do you think the refined model has allowed for? Take it further Investigate Lissajous curves. (See investigation on separate sheet.) Where this goes next At A level parametric equations are studied in Core Mathematics and Mechanics. © MEI 2009 GCSE Mathematics Extension Material NA 11E Plotting curves: Extension Extension: Lissajous curves You will need a graphical calculator or suitable mathematics software (for example Autograph or Geogebra) to complete this investigation. The greater resolution on a computer display makes computer software preferable, particularly for the later parts. x Copy and complete this table, giving any decimal answers to 1 decimal place. ș x = 4 sin(ș + 90°) y = 4 sin ș ș x = 4 sin(ș + 90°) y = 4 sin ș x x x x 0° 4 0 30° 45° 60° 2 3.5 90° 120° 135° 150° 180° –2.8 2.8 210° 225° 240° 270° 300° 315° 330° 360° 3.5 –2 Draw the curve with parametric equations x = 4 sin(ș + 90°), y = 4 sin ș on graph paper, using the same scales for x and y. What well-known curve have you drawn? Now use a graphical calculator or computer software set for parametric equations to obtain the same curve. You will need to set the x and y scales so that the curve looks right. You will also need to set the step length, say every 5°, for the parameter for 0° to 360°. Now try with the parameter from 0° to 720°. Explain what has happened. Now, using a graphical calculator or computer software, investigate the curves with the following parametric equations. Make sure you choose a sufficient range of values of ș to obtain the whole curve. x = 4 sin ș, y = 3 sin 2ș x = 4 sin(ș + 55°), y = 3 sin 2ș x = 4 sin ș, y = 3 sin 3ș x = 4 sin ș, y = 3 sin 5ș These are all examples of Lissajous curves. Their parametric equations all have the form x = P sin(aș + Į°), y = Q sin(bș), where P, Q, a, b and D are all numbers that you can change to make different members of the family of curves. Lissajous curves are formed when two oscillations, one in the x-direction and the other in the y-direction, are combined. The oscillations can have different amplitudes (P and Q), different frequencies (determined by a and b) and can be out of phase with each other (by Į°). They were first investigated by Nathaniel Bowditch in 1815 and later, in more depth, by Jules Antoine Lissajous in 1857. Lissajous curves have some applications in science and astronomy but for many people their interest lies more in their variety and beauty. They are sometimes used in the design of logos; for example, that for the Australian Broadcasting Corporation is based on the case P = 3, Q = 2, a = 1, b = 3 and Į = 90°. x Investigate the curves you get for different values of P, Q, a, b and Į. Then make a poster showing a number of your favourite curves. © MEI 2009
