Name Date Using Statistics to Compare Background Radiation to a Radioactive Source
advertisement
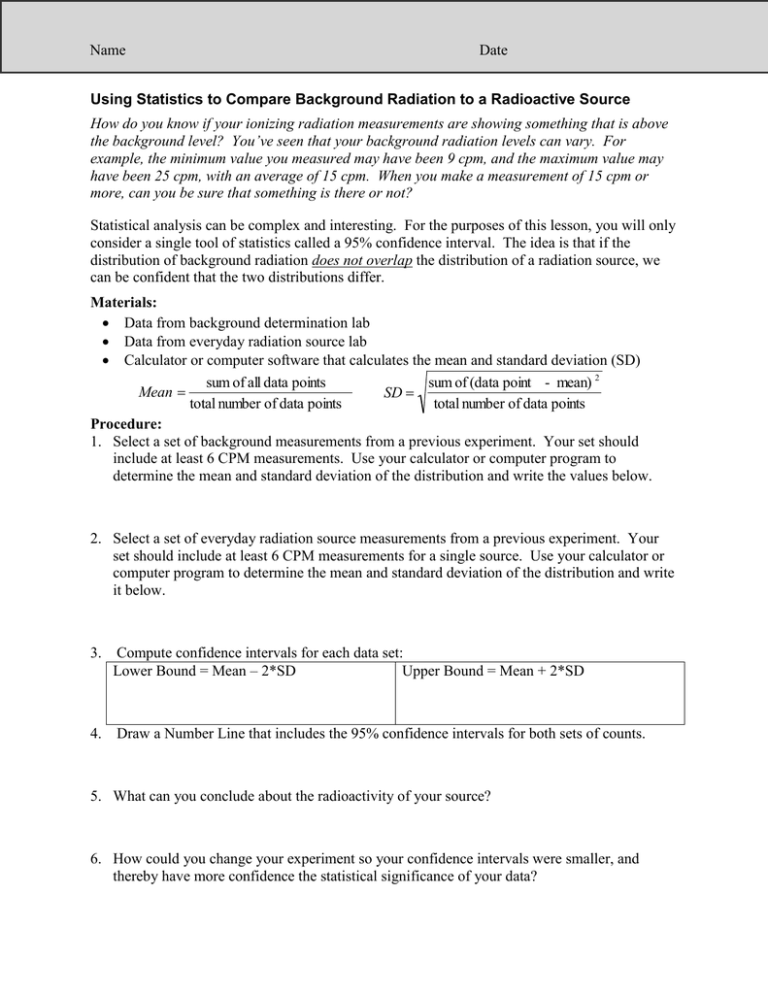
Name Date Using Statistics to Compare Background Radiation to a Radioactive Source How do you know if your ionizing radiation measurements are showing something that is above the background level? You’ve seen that your background radiation levels can vary. For example, the minimum value you measured may have been 9 cpm, and the maximum value may have been 25 cpm, with an average of 15 cpm. When you make a measurement of 15 cpm or more, can you be sure that something is there or not? Statistical analysis can be complex and interesting. For the purposes of this lesson, you will only consider a single tool of statistics called a 95% confidence interval. The idea is that if the distribution of background radiation does not overlap the distribution of a radiation source, we can be confident that the two distributions differ. Materials: Data from background determination lab Data from everyday radiation source lab Calculator or computer software that calculates the mean and standard deviation (SD) sum of all data points sum of (data point - mean) 2 Mean SD total number of data points total number of data points Procedure: 1. Select a set of background measurements from a previous experiment. Your set should include at least 6 CPM measurements. Use your calculator or computer program to determine the mean and standard deviation of the distribution and write the values below. 2. Select a set of everyday radiation source measurements from a previous experiment. Your set should include at least 6 CPM measurements for a single source. Use your calculator or computer program to determine the mean and standard deviation of the distribution and write it below. 3. Compute confidence intervals for each data set: Lower Bound = Mean – 2*SD Upper Bound = Mean + 2*SD 4. Draw a Number Line that includes the 95% confidence intervals for both sets of counts. 5. What can you conclude about the radioactivity of your source? 6. How could you change your experiment so your confidence intervals were smaller, and thereby have more confidence the statistical significance of your data?

