MEI Tasks for Casio Graphical Calculators Statistics on the fx-9860
advertisement
MEI Tasks for Casio Graphical Calculators
Statistics on the fx-9860
Mean and standard deviation of single variable data
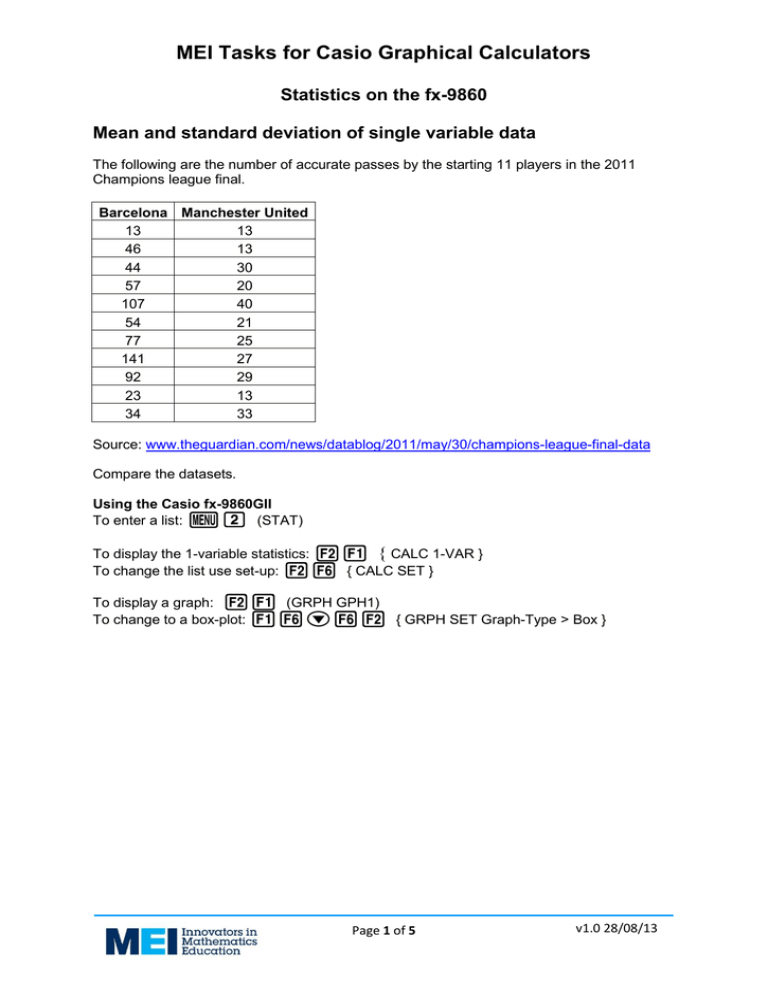
The following are the number of accurate passes by the starting 11 players in the 2011
Champions league final.
Barcelona Manchester United
13
13
46
13
44
30
57
20
107
40
54
21
77
25
141
27
92
29
23
13
34
33
Source: www.theguardian.com/news/datablog/2011/may/30/champions-league-final-data
Compare the datasets.
Using the Casio fx-9860GII
To enter a list: p2 (STAT)
To display the 1-variable statistics: wq { CALC 1-VAR }
To change the list use set-up: wu { CALC SET }
To display a graph: wq (GRPH GPH1)
To change to a box-plot: quNuw { GRPH SET Graph-Type > Box }
Page 1 of 5
v1.0 28/08/13
MEI Tasks for Casio Graphical Calculators
Mean and standard deviation of grouped data
Compare the batting performances in the 2013 Ashes series:
Score
0-9
10-19
20-29
30-39
40-49
50-74
75-99
100-149
150-199
England
Australia
Frequency Frequency
30
40
18
23
11
15
10
5
7
3
13
9
0
4
4
2
1
2
Source: http://www.espncricinfo.com/
Using the Casio fx-9860GII
To use a list as a frequency select set-up: wu { CALC SET }
Page 2 of 5
v1.0 28/08/13
MEI Tasks for Casio Graphical Calculators
Discrete random variables
What is the expected winnings on the national lottery?
6 main numbers (jackpot)
5 main numbers plus bonus ball
5 main numbers
4 main numbers
3 main numbers
0, 1 or 2 main numbers
Prize
£2 000 000
£100 000
£1 500
£62
£10
£0
Probability
0.000 000 07
0.000 000 43
0.000 018 02
0.000 968 05
0.017 543 86
0.981 469 57
Source: https://www.national-lottery.co.uk/player/p/help/aboutlotto/prizecalculation.ftl
Using the Casio fx-9860GII
To enter a probability distribution use the probabilities as frequencies.
Page 3 of 5
v1.0 28/08/13
MEI Tasks for Casio Graphical Calculators
Normal Distribution
Assuming the heights of adult males in the UK are Normally distributed with mean 175.4cm
and standard deviation 9.1cm (source: http://en.wikipedia.org/wiki/Human_height).
What proportion of the population would you expect to be over 1.9m?
What proportion of the population would you expect to be between 1.7m and 1.8m?
What height would you recommend door frames be made at?
Using the Casio fx-9860GII
Calculate the standardised z-value: z
x
Find P( Z z ) using: p1iueuq{ MENU RUN Option > Prob > P( }
To plot the curve use: p2yqw{ MENU STAT DIST NORM Ncd }
Set Data to “Variable”, and set the mean, standard deviation and limits. Scroll down and
select u{ DRAW }
For a 1-tail probability use an extreme value (e.g. Lower: –1000)
Page 4 of 5
v1.0 28/08/13
MEI Tasks for Casio Graphical Calculators
Bivariate data
The number of benefit claimants and the yield from fixed odds betting terminals for 10
constituencies in the North East of England is shown below:
Claimant
count
Yield from FOBTs
In £1,000,000s
Darlington
3462
2.37
Easington
3406
1.99
Hartlepool
4715
2.49
Houghton and Sunderland South
2784
1.87
Middlesbrough
5961
3.86
Middlesbrough South and East Cleveland
3452
1.75
North Tyneside
3802
3.36
Redcar
3984
2.37
Stockton North
4173
3.12
Stockton South
2951
1.63
Westminster constituency name
Source: http://www.theguardian.com/news/datablog/2013/jan/04/5bn-gambled-britianpoorest-high-street
Is there a link between these?
NB The critical value of the product moment correlation coefficient for n = 10 at the 5% level
is 0.5494.
Using the Casio fx-9860GII
To display the regression and correlation statistics: weqq { CALC REG X ax+b }
The PMCC is the value of r.
Page 5 of 5
v1.0 28/08/13


