Flumes for Open-Channel Flow Measurement Dune
Lecture 2
Flumes for Open-Channel Flow Measurement
“Superb accuracy in water measurement, Jessica thought.”
Dune
, F. Herbert (1965)
I. Procedure for Installing a Parshall Flume to Ensure Free Flow
• If possible, you will want to specify the installation of a Parshall flume such that it operates under free-flow conditions throughout the required flow range
• To do this, you need to specify the minimum elevation of the upstream floor of the flume
• Follow these simple steps to obtain a free-flow in a Parshall flume, up to a specified maximum discharge:
1. Determine the maximum flow rate (discharge) to be measured
2. Locate the high water line on the canal bank where the flume is to be installed, or otherwise determine the maximum depth of flow on the upstream side
3. Select a standard flume size and calculate h u
from the free-flow equation corresponding to the maximum discharge capacity of the canal
4. Place the floor of the flume at a depth not exceeding the transition submergence, S t
, multiplied by h u
below the high water line
• In general, the floor of the flume should be placed as high in the canal as grade and other conditions permit, but not so high that upstream free board is compromised.
• The downstream water surface elevation will be unaffected by the installation of the flume (at least for the same flow rate)
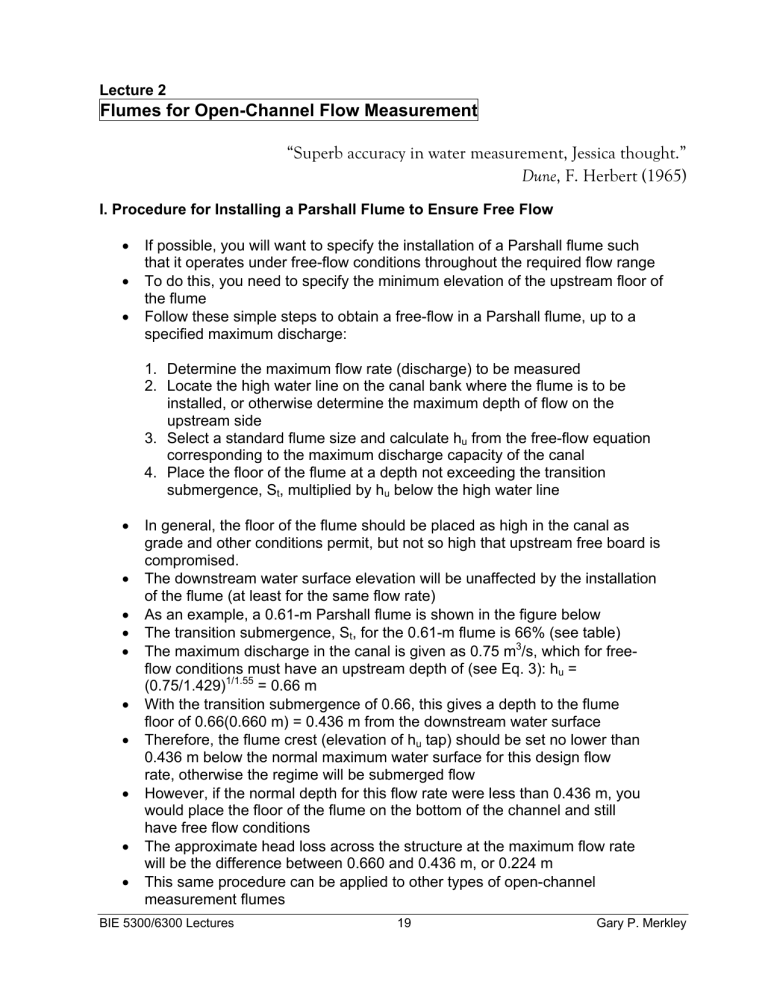
• As an example, a 0.61-m Parshall flume is shown in the figure below
• The transition submergence, S t
, for the 0.61-m flume is 66% (see table)
• The maximum discharge in the canal is given as 0.75 m 3 /s, which for freeflow conditions must have an upstream depth of (see Eq. 3): h u
=
(0.75/1.429) 1/1.55
= 0.66 m
• With the transition submergence of 0.66, this gives a depth to the flume floor of 0.66(0.660 m) = 0.436 m from the downstream water surface
• Therefore, the flume crest (elevation of h u
tap) should be set no lower than
0.436 m below the normal maximum water surface for this design flow rate, otherwise the regime will be submerged flow
• However, if the normal depth for this flow rate were less than 0.436 m, you would place the floor of the flume on the bottom of the channel and still have free flow conditions
• The approximate head loss across the structure at the maximum flow rate will be the difference between 0.660 and 0.436 m, or 0.224 m
• This same procedure can be applied to other types of open-channel measurement flumes
BIE 5300/6300 Lectures 19 Gary P. Merkley
II. Non-Standard Parshall Flume Calibrations
• Some Parshall flumes were incorrectly constructed or were intentionally built with a non-standard size
• Others have settled over time such that the flume is out of level either cross-wise or longitudinally (in the direction of flow), or both
• Some flumes have the taps for measuring h u
and h d
at the wrong locations (too high or too low, or too far upstream or downstream)
• Some flumes have moss, weeds, sediment or other debris that cause the calibration to shift from that given for standard conditions
• Several researchers have worked independently to develop calibration adjustments for many of the unfortunate anomalies that have befallen many
Parshall flumes in the field, but a general calibration for non-standard flumes requires 3-D modeling
• There are calibration corrections for out-of-level installations and for low-flow conditions
III. Hysteresis Effects in Parshall Flumes
• There have been reports by some researchers that hysteresis effects have been observed in the laboratory under submerged-flow conditions in Parshall flumes
• The effect is to have two different flow rates for the same submergence, S, value, depending on whether the downstream depth is rising or falling
• There is no evidence of this hysteresis effect in Cutthroat flumes, which are discussed below
IV. Software
• You can use the ACA program to develop calibration tables for Parshall,
•
Cutthroat, and trapezoidal flumes
Download from: http://www.engineering.usu.edu/bie/faculty/merkley/Software.htm
• You can also download the
WinFlume
program from: http://www.usbr.gov/pmts/hydraulics_lab/winflume/index.html
Gary P. Merkley 20 BIE 5300/6300 Lectures
V. Submerged-Flow, Constant Flow Rate
• Suppose you have a constant flow rate through a Parshall flume
• How will h u
change for different h d
values under submerged-flow conditions?
• This situation could occur in a laboratory flume, or in the field where a downstream gate is incrementally closed, raising the depth downstream of the
Parshall flume, but with a constant upstream inflow
• The graph below is for steady-state flow conditions with a 0.914-m Parshall flume
• Note that h u
is always greater than h d
(otherwise the flow would move upstream, or there would be no flow)
BIE 5300/6300 Lectures 21 Gary P. Merkley
Parshall Flume (W = 0.914 m)
0.6
0.5
0.8
0.7
1.0
0.9
0.4
0.4
Submerged flow conditions.
Constant flow rate: Q s
= 1.00
m /s.
0.5
0.6
0.7
hd
0.8
hd
(m)
0.15
0.20
0.25
0.30
0.35
0.40
0.45
0.50
0.55
0.60
0.65
0.70
0.75
0.80
0.85
0.90
hu
(m)
0.714
0.664
0.634
0.619
0.615
0.619
0.650
0.674
0.703
0.736
0.772
0.811
0.852
0.894
0.938
Q
(m3/s)
0.999
0.999
0.999
1.000
1.002
1.000
1.000
1.001
1.000
1.000
1.000
0.999
1.001
1.004
1.000
1.002
S Regime
0.210 free
0.301 free
0.394 free
0.485 free
0.569 free
0.646 free
0.713 submerged
0.769 submerged
0.816 submerged
0.853 submerged
0.883 submerged
0.907 submerged
0.925 submerged
0.939
submerged
0.951 submerged
0.959 submerged
0.9
1.0
Gary P. Merkley 22 BIE 5300/6300 Lectures
VI. Cutthroat Flumes
• The Cutthroat flume was developed at USU from 1966-1990
• A Cutthroat flume is a rectangular openchannel constriction with a flat bottom and zero length in the throat section (earlier versions did have a throat section)
• Because the flume has a throat section of zero length, the flume was given the name
“Cutthroat” by the developers (Skogerboe, et al. 1967)
• The floor of the flume is level (as oppo following advantages:
A Cutthroat flume sed to a Parshall flume), which has the
1. ease of construction
−
the flume can be readily placed inside a concrete-lined channel
2. the flume can be placed on the channel bed
• The Cutthroat flume was developed to operate satisfactorily under both free-flow and submerged-flow conditions
• Unlike Parshall flumes, all Cutthroat flumes have the same dimensional ratios
• It has been shown by experiment that downstream flow depths measured in the diverging outlet section give more accurate submerged-flow calibration curves than those measured in the throat section of a Parshall flume
• The centers of the taps for the US and DS head measurements are both located
½-inch above the floor of the flume, and the tap diameters should be ¼-inch
Cutthroat Flume Sizes
• The dimensions of a Cutthroat flume are identified by the flume width and length
(W x L, e.g. 4” x 3.0’)
• The flume lengths of 1.5, 3.0, 4.5, 6.0, 7.5, 9.0 ft are sufficient for most applications
• The most common ratios of W/L are 1/9, 2/9, 3/9, and 4/9
• The recommended ratio of h u
/L is equal to or less than 0.33
Free-flow equation
• For Cutthroat flumes the free-flow equation takes the same general form as for
Parshall flumes, and other channel “constrictions”:
Q f
= ( ) n f (1) where Q f
is the free-flow discharge; W is the throat width; C f
is the free-flow coefficient; and n f
is the free-flow exponent
BIE 5300/6300 Lectures 23 Gary P. Merkley
• That almost any non-orifice constriction in an open channel can be calibrated using Eq. 1, given free-flow conditions
• The depth, h flume floor) u
, is measured from the upstream tap location (½-inch above the
3 6
1 1
W
Flow
Inlet
Section
Outlet
Section
Piezometer
Tap for h u
Top View
Piezometer
Tap for h d
H
L
Side View
• For a ny given flume size, the flume wall height, H, is equal to h acco rding to the above equation, although a slig to prevent the occurrence of overflow u
for Q max
, htly larger H-value can be used
• So, solve the above free-flow equation for h u
, and apply the appropriate Q max value from the table below; the minimum H-value is equal to the calculated h u
Gary P. Merkley 24 BIE 5300/6300 Lectures
Submerged-flow equation
• For Cutthroat flumes the submerged-flow equation also takes the same general form as for Parshall flumes, and othe r channel constrictions:
Q s
=
C W(h u
− h )
[ (log S)] d n s n f
(2) where C s
= submerged-flow coefficient; W is the throat width; and S = h d
/h u
• Equation 2 differs from the submerged-flow equ ation given previously for
Parshall flumes in that the C
2
term is omitted
• The coefficients C f
and C s
are functions of flume length, L, and throat width, W
• The generalized free-flow and submerged-flow coefficients and e xponents for standard-sized Cutthroat flumes can be taken from the following table (metric units: for Q in m 3 /s and head (depth) in m, and using a base 10 logarithm in Eq.
2)
•
Almost any non-orifice constriction in an open channel can be calibrated using
Eq. 2, given submer ged-flow conditions
Cutthroat Flume Calibration Parameters for metric units
(depth and W in m and flow rate in m
3
/s)
W (m) L (m) C f n f
S t
C s n s
Discharge (m min
0.051 0.457 5.673
1.98
0.553
3.894
1.45
0.0001
3
/s) max
0.007
0.102 0.457 5.675
1.97
0.651
3.191
1.58
0.0002
0.152 0.457 5.639
1.95
0.734
2.634
1.67
0.0004
0.203 0.457 5.579
1.94
0.798
2.241
1.73
0.0005
0.102 0.914 3.483
1.84
0.580
2.337
1.38
0.0002
0.203 0.914 3.486
1.83
0.674
1.952
1.49
0.0005
0.014
0.022
0.030
0.040
0.081
0.305 0.914 3.459
1.81
0.754
1.636
1.57
0.0008
0.406 0.914 3.427
1.80
0.815
1.411
1.64
0.0011
0.152 1.372 2.702
1.72
0.614
1.752
1.34
0.0005
0.305 1.372 2.704
1.71
0.708
1.469
1.49
0.0010
0.457 1.372 2.684
1.69
0.
788 1.238
1.50
0.0015
0.610 1.372 2.658
1.68
0.849
1.070
1.54
0.0021
0.123
0.165
0.107
0.217
0.326
0.436
0.203 1.829 2.351
1.66
0.629
1.506
1.30
0.0007
0.406 1.829 2.353
1.64
0.723
1.269
1.39
0.0014
0.610 1.829 2.335
1.63
0.
0.813 1.829 2.315
1.61
0.862
0.934
1.50
0.0031
0.254 2.286 2.147
1.61
0.641
1.363
1.28
0.0009
0.508 2.286 2.148
1.60
0.735
1.152
1.37
0.0019
0.762 2.286 2.131
1.58
0.811
0.982
1.42
0.0031
1.016 2.286 2.111
1.57
0.873
0.850
1.47
0.0043
0.305 2.743 2.030
1.58
0.651
1.279
1.27
0.0012
0.610 2.743 2.031
1.57
0.743
1.085
1.35
0.0025
0.914 2.743 2.024
1.219 2.743 2.000
1.55
1.54
801 1.077
1.45
0.0023
0.820
0.882
0.929
0.804
1.40
1.44
0.0039
0.0055
0.210
0.424
0.636
0.846
0.352
0.707
1.056
1.400
0.537
1.076
1.611
2.124
BIE 5300/6300 Lectures 25 Gary P. Merkley
• Note that n f
approaches 1.5 for larger W values, but never gets down to 1.5
• As for the Parshall flume data given previously, the submerged-flow calibration is for base 10 logarithms
• Note that the coefficient conversion to English units is as follows:
C f (English)
=
(0.3048)
+ f
(0.3048)
3
C f (metric)
(3)
• The next table shows the calibration parameters for English units
Cutthroat Flume Calibration Parameters for English units
(depth and W in ft and flow rate in cfs)
Discharge (cfs)
W (ft) L (ft) C f n f
S t
C s n s
0.167
1.50
5.796
1.98
0.553
3.978
1.45
0.333
1.50
5.895
1.97
0.651
3.315
1.58
0.500
1.50
5.956
1.95
0.734
2.782
1.67
0.667
1.50
5.999
1.94
0.798
2.409
1.73
0.333
3.00
4.212
1.84
0.580
2.826
1.38
0.667
3.00
4.287
1.83
0.674
2.400
1.49
1.000
3.00
4.330
1.81
0.754
2.048
1.57
1.333
3.00
4.361
1.80
0.815
1.796
1.64
0.500
4.50
3.764
1.72
0.614
2.440
1.34
1.000
4.50
3.830
1.71
0.708
2.081
1.49
1.500
4.50
3.869
1.69
0.788
1.785
1.50
2.000
4.50
3.897
1.68
0.849
1.569
1.54
0.667
6.00
3.534
1.66
0.629
2.264
1.30
1.333
6.00
3.596
1.64
0.723
1.940
1.39
2.000
6.00
3.633
1.63
0.801
1.676
1.45
2.667
6.00
3.662
1.61
0.862
1.478
1.50
0.833
7.50
3.400
1.61
0.641
2.159
1.28
1.667
7.50
3.459
1.60
0.735
1.855
1.37
2.500
7.50
3.494
1.58
0.811
1.610
1.42
3.333
7.50
3.519
1.57
0.873
1.417
1.47
1.000
9.00
3.340
1.58
0.651
2.104
1.27
2.000
9.00
3.398
1.57
0.743
1.815
1.35
max
0.24
0.50
0.77
1.04
1.40
2.86
4.33
5.82
3.78
7.65
11.5
15.4
7.43
15.0
22.5
29.9
12.4
25.0
37.3
49.4
19.0
38.0
min
0.004
0.008
0.013
0.018
0.009
0.018
0.029
0.040
0.016
0.034
0.053
0.074
0.024
0.050
0.080
0.111
0.032
0.068
0.108
0.151
0.042
0.088
3.000
9.00
3.442
1.55
0.820
1.580
1.40
4.000
9.00
3.458
1.54
0.882
1.390
1.44
0.139
0.194
56.9
75.0
Unified Discharge Calibrations
• Skogerboe also developed “unified discharge” calibrations for Cutthroat flumes, such that it is not necessary to select from the above standard flume sizes
• A regression analysis on the graphical results from Skogerboe yields these five calibration parameter equations:
C f
= 6.5851L
− 0.3310
W
1.025
(4)
Gary P. Merkley 26 BIE 5300/6300 Lectures
n f
= 2.0936L
− 0.1225
− 0.128(W / L) (5) n s
= 2.003(W / L)
0.1318
L
− −
(6)
S t
= 0.9653(W / L) L
− 0.3555
(7)
C s
=
C f
( − log S t
( − t
) n f
) n s
(8)
• Note that Eqs. 4-8 are for English units (L and W in ft; Q in cfs)
• The maximum percent difference in the Cu tthroat flume calibration parameters is less than 2%, comparing the results of Eqs. 4-8 with the calibration parameters for the 24 standard Cutthroat flume sizes
V II.
Trapezoidal Flu mes
• Trapezoidal flumes are often used for small flows, such as for individual furrows in surface irrigation evaluations
• The typical standard calibrated flume is composed of five sections: approach, converging, throat, diverging, and exit
• However, the approach and exit sections are not necessary part of the flume itself
• Ideally, trapezoidal flumes can measure discharge with an accuracy of ± 5% under free-flow conditions
• But the attainment of this level of accuracy depends on proper installation, accurate stage measurement, and adherence to specified tolerances in the construction of the throat section
• Discharge measurement errors are approximately 1.5 to 2.5 times the error in the stage reading for correctly installed flumes with variations in throat geometry from rectangular to triangular sections
BIE 5300/6300 Lectures 27 Gary P. Merkley
Gary P. Merkley 28 BIE 5300/6300 Lectures
• In the following table with seven trapezoidal flume sizes, the first two flumes are
V-notch (zero base width in the throat, and the last five have trapezoidal throat cross se ctions
F lume
Numb er
1
2
3
6
7
4
5
Description
Dimensions (inches)
A B C D E F G P R S U W
Large 60 o
-V 7.00 6.90 7.00 3.00 7.00 1.00 6.75 2.00 1.50 4.00 3.50 0.00
Small 60 o
-V 5.00 6.05 5.00 2.00 4.25 1.00 4.00 2.00 1.00 2.38 2.50 0 .00
2”-60 o
WSC 8.00
6.41 8.50 3.00 8.50 1.00 13.50 4.90 1.50 6.00 4.30 2.00
2”-45 WSC 8.00 8.38 8.50 3.00 8.50 1.00 10.60 4.90 1.50 10.60 4.30 2.00
2”-30 o
WSC 8.00 8.38 8.50 3.00
8.
50 1.00 10.00 4.90 1.50 17.30 4.30 2.00
4”-60 o
WSC 9.00 9.81 10.00 3.00 10.00 1.00 13.90 8.00 1.50 8.00 5.00 4.00
2”-30 o
CSU 10.00 10.00 10.00 3.00 10.80 1.00 9.70 10.00 1.50 16.80 5.00 2.00
Note: A ll dimension s are in inches. WSC are Washington State Univ Calibrations, while CSU are
Co lorado State Univ Calibrations (adapted from Robinson & Chamberlain 1960)
• Trapezoidal flume calibrations are for free-flow regimes only (although it would be possible to generate submerged-flow cal ibrations from laboratory data)
• The following equation is used for free-flow calibration
Q f
= ( ) n ft (9) wh ere the calibration parameters for the above seven flume sizes are given in the table below:
Q max
Flume
C ft n ft
Number
1
2
3
1.55
1.55
1.99
2.58
2.58
2.04
4
5
6
7
3.32
5.92
2.63
4.80
2.18
2.28
1.83
2.26
Note: for h u
in ft and Q in cfs
(cfs)
0.35
0.09
2.53
2.53
3.91
3.44
2.97
• When the throat base width of a trapezoidal flume is zero (W = 0, usually for the smaller sizes), these are called “V-notch flumes”
• Similar to the V-notch weir, it is most commonly used for measuring water with a small head due to a more rapid change of head with change in discharge
• Flume numbers 1 and 2 above are V-notch flumes because they have W = 0
BIE 5300/6300 Lectures 29 Gary P. Merkley
VIII. Flume Calibration Procedure
• Sometimes it is necessary to develop site-specific calibrations in the field or in the laboratory
• For example, you might need to develop a o r a flume that was constructed to nonstan
custom calibration for a “hybrid” flume, dard dimensions
• To calibrate based on field data for flow measurement, it is desire d to find flow rating conditions for both free-flow and submerged-flow
• To analyze and solve for the value of the unknown parameters in the flow rating equation the following procedure applies:
1. Transform the exponential equation into a linear equation using logarithms
2. The slope and intersection of this line can be obtained by fitting the transformed data using linear regression, or graphically with log-log paper
3. Finally, back-calculate to solve for the required unknown values
The linear equation is:
Y a bX (10)
The transformed flume equations are:
Free-flow:
= ( ) + n log(h ) (11)
So, applying Eq. 10 with measured pairs of Q f
and h u
, “a” is log C f
and “b” is n f
Submerged-flow: log
⎡
⎢
Q s
(h u
− h ) n f
⎤
⎥ = − s
[
−
]
(12)
Again, applying Eq. 10 with measured pairs of Q s
“b” is n s
and h u
and h d
, “a” is log C s
and
• Straight lines can be plotted to show the relationship between log h u
and log Q f for a free-flow rating, and between log (h u
-h d
) and log Q
S
with several degrees of submergence for a submerged-flow rating
• If this is done using field or laboratory data, any base logarithm can be used, but the base must be specified
• Multiple linear regression can also be used to determine C s
, n f
, and n s
for submerged flow data only
−
this is discussed further in a later lecture
Gary P. Merkley 30 BIE 5300/6300 Lectures
IX. Sample Flume Calibrations
Free Flow
• Laboratory data for free-flow conditions in a flume are shown in the following table
• Free-flow conditions were determined for these data because a hydraulic jump was seen downstream of the throat section, indicating supercritical flow in t he vicinity of the throat
Q (cfs)
4.746
3.978
3.978
2.737
2.737
2.211
1.434
1.019
1.019
1.019
1.019
0.678
hu (ft)
1.087
0.985
0.985
0.799
0.798
0.
707
0.533
0.436
0.436
0.436
0.436
0.337
•
•
Take the logarithm of Q and of h u and 11)
, then perform a linear regression (see Eqs . 10
The linear regression gives an R equation:
2 value of 0.999 for the following calibration
Q f
= 4.04h
1.66
u
(13)
•
• where Q f
is in cfs; and h u
is in ft
We could modify Eq. 13 to fit the form of Eq. 6, but for a custom flume calibration it is convenient to just include t he throat width, W, in the coefficient, as shown in
Eq. 13
Note that the coefficient and exponent values in Eq. 13 have been rounded to three signific ant digits each – never show more precision than you can justify
Submerged Flow
• Data were then collected under submerged-flow conditions in the same flume
• The existence of submerged flow in the flume was verified by noting that th ere is not downstream hydraulic jump, and that any slight change in downstream depth produces a change in the upst ream depth, for a constant flow rate
• Note that a constant flow rate for varying depths can usually only be obtained i a hydraulics laboratory, or in the field where there is an upstream pump, with an n unsubmerged outlet, delivering water to the channel
BIE 5300/6300 Lectures 31 Gary P. Merkley
• Groups of (essentially) constant flow rate data were taken, varying a downstream gate to change the submergence values, as shown in the table below
0.827
0.840
0.858
0.880
0.916
0.972
0.437
0.800
0.801
0.805
0.812
0.803
0.808
0.818
0.441
0.445
0.461
0.483
0.520
hu (ft)
0.988
1.003
1.012
1.017
1.024
1.035
1.043
1.055
1.066
1.080
1.100
1.124
2.733
2.733
2.733
2.733
2.733
2.733
1.019
2.737
2.736
2.734
2.734
2.733
2.733
2.733
1.019
1.010
1.008
1.006
1.006
Q (cfs)
3.978
3.978
3.978
3.978
3.978
3.978
3.978
3.978
3.978
3.978
3.978
3.978
0.714
0.743
0.785
0.823
0.876
0.943
0.388
0.560
0.581
0.623
0.659
0.609
0.642
0.683
0.403
0.418
0.434
0.462
hd (ft)
0.639
0.753
0.785
0.825
0.852
0.872
0.898
0.933
0.952
0.975
1.002
1.045
0.506
• In this case, we will use n f
in the submerged-flow equation (see Eq. 12), where n
= 1.66, as determined above
• Perform a linear regression for ln[Q/(h S], as shown in Eq. f
12, giving an R 2 of 0.998 for u
– h d
) 1.66
] and ln[-log
10
Q s
=
( −
( u
− h d
) 1.66
) 1.45
(14) where Q s
is in cfs; and h u
and h d
are in ft
• You should verify the above results in a spreadsheet application
Gary P. Merkley 32 BIE 5300/6300 Lectures
References & Bibliography
Abt, S.R., Florentin, C. B., Genovez, A., and B.C. Ruth. 1995. Settlement and submergence adjustments for Parshall flume . ASCE J. Irrig. and Drain. Engrg. 121(5).
Abt, S., R. Genovez, A., and C.B. F lorentin. 1994. Correction for settlement in submerged Parshall flumes . ASCE J. Irrig. and Drain. Engrg.
120(3).
Ackers, P., White, W. R., Perkins, J.A., and A.J.M. Harrison. 1978. Weirs and flumes for flow measurement . John Wiley and Sons, Ne w York, N.Y.
Genovez, A., A bt, S., Florentin, B., and A. Garton. 1993. Correction for settlement of Parshall flume .
J. Irrigation and Drainage Engineering. Vol. 119, No. 6. ASCE.
Kraatz D.B. and Mahajan I.K. 1975. Small hydraulic st ructures . Food and Agriculture Organization of the United Nations, Rome, Italy.
Par shall, R.L. 1950. Measuring water in irrigatio n channels with Parshall flumes and small weirs . U.S.
Department of Agriculture, SCS Circular No. 843 .
Pa r shall R.L. 1953. Parshall flumes of la rge size . U.S. Department of Agriculture, SCS and
Agricultural Experiment Station, Colorado State Un iversity, Bulletin 426-A.
Robinson, A.R. 1957. Parshall measuring flumes of sm all sizes . Agricultural Experiment Station,
Colorado State University, Technical Bulletin 61.
Robinson A. R. and A.R. Chamberlain. 1960. Trapezoidal flumes for open-channel flow measurement . ASAE Tran sactions, vol.3, No.2. Trans. of American Society of Agricultural
Engineers, St. Joseph, Michigan.
Sko gerboe, G.V., Hyatt, M. L., England, J.D., and J. R . Johnson. 1965a. Submerged Parshall flumes of small size . Report PR-WR6-1. Utah Water Research Laboratory, Lo gan, Utah.
Skogerboe, G.V., Hyatt, M. L., England, J.D., and J. R. Johnson. 1965c. Measuring water with
Parshall flumes . Utah Water Research Laboratory, Logan, Utah.
Skogerboe, G. V., Hyatt, M. L., Anderson, R. K., and K.O. Eggleston. 1967a. Design and calibra tion of submerged open channel flow measurement structures, Part3: Cutthroat flumes . Utah Water
Research Laboratory, Logan, Utah.
Skogerboe, G.V., Hyatt, M.L. and K.O. Eggleston 1967b. Design and calibration of submerged open channel flow measuring structures, Part1: Subme rged flow . Utah Water Research Laboratory.
Logan, Utah.
Skogerboe, G.V., Hyatt, M. L., England, J.D., and J. R. Johnson. 1965b. Submergence in a two-foot
Parshall flume . Report PR-W R6-2. Utah Water Research Laboratory, Logan, Utah.
J. R. Johnson. 1967c. Design and calibration of submerged open-channel flow measuring struc tures Part2: Parshall flumes. Utah Water
Research Laboratory. Logan, Utah.
Wo rking Group on Small Hydraulic Structures. 1978. D ischarge Measurement Structures , 2 nd
ed.
International Institute for Land Reclamation and Improvement/ILRI, Wageningen, Netherlands.
BIE 5300/6300 Lectures 33 Gary P. Merkley
Wright J.S. and B. Taheri. 1991. Correction to Parshall flume calibrations at low discharges . ASCE J .
Irrig. and Drain. Engrg.117(5).
Wright J.S., Tullis, B.P., and T.M. Tamara. 1994. Recalibration of Parshall flumes at low discharges .
J. Irrigation and Drain age Engineering, vol.120, No 2, ASCE.
Gary P. Merkley 34 BIE 5300/6300 Lectures
