Document 10434893
advertisement
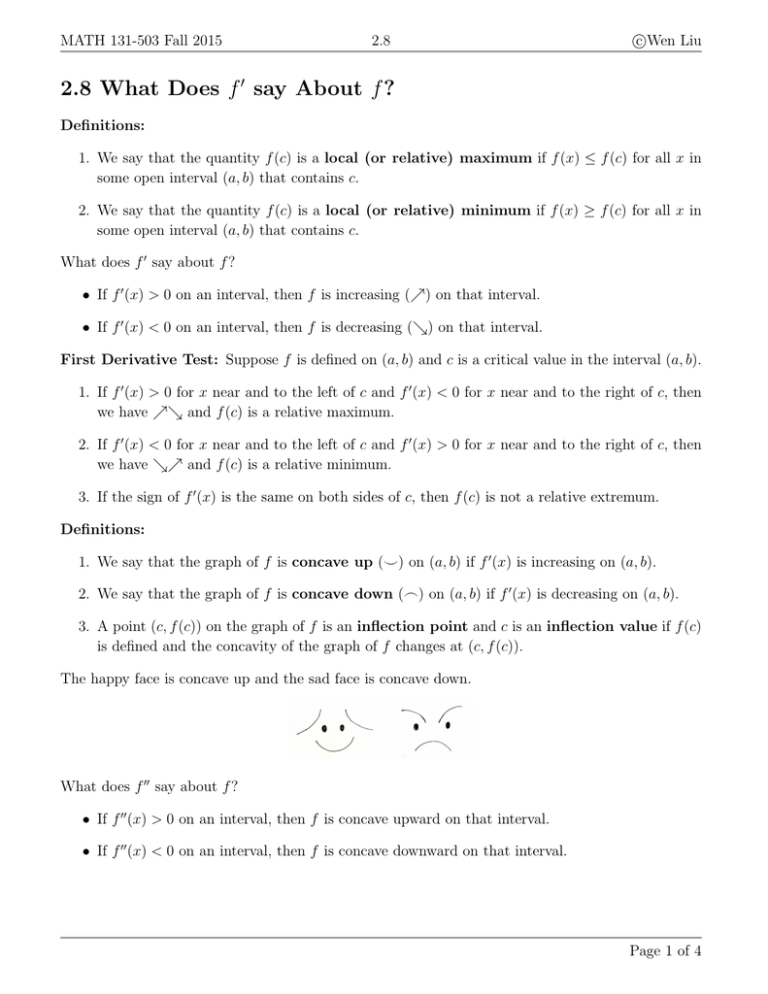
MATH 131-503 Fall 2015 2.8 c Wen Liu 2.8 What Does f 0 say About f ? Definitions: 1. We say that the quantity f (c) is a local (or relative) maximum if f (x) ≤ f (c) for all x in some open interval (a, b) that contains c. 2. We say that the quantity f (c) is a local (or relative) minimum if f (x) ≥ f (c) for all x in some open interval (a, b) that contains c. What does f 0 say about f ? • If f 0 (x) > 0 on an interval, then f is increasing (%) on that interval. • If f 0 (x) < 0 on an interval, then f is decreasing (&) on that interval. First Derivative Test: Suppose f is defined on (a, b) and c is a critical value in the interval (a, b). 1. If f 0 (x) > 0 for x near and to the left of c and f 0 (x) < 0 for x near and to the right of c, then we have %& and f (c) is a relative maximum. 2. If f 0 (x) < 0 for x near and to the left of c and f 0 (x) > 0 for x near and to the right of c, then we have &% and f (c) is a relative minimum. 3. If the sign of f 0 (x) is the same on both sides of c, then f (c) is not a relative extremum. Definitions: 1. We say that the graph of f is concave up (^) on (a, b) if f 0 (x) is increasing on (a, b). 2. We say that the graph of f is concave down (_) on (a, b) if f 0 (x) is decreasing on (a, b). 3. A point (c, f (c)) on the graph of f is an inflection point and c is an inflection value if f (c) is defined and the concavity of the graph of f changes at (c, f (c)). The happy face is concave up and the sad face is concave down. What does f 00 say about f ? • If f 00 (x) > 0 on an interval, then f is concave upward on that interval. • If f 00 (x) < 0 on an interval, then f is concave downward on that interval. Page 1 of 4 MATH 131-503 Fall 2015 2.8 c Wen Liu Examples: 1. Use the given graph of f to find the following. (a) On what intervals is f increasing? Decreasing? (b) On what intervals is f concave up? Concave down? (c) The coordinates of the points of inflection. 2. Let f (t) be the temperature at time t where you live and suppose that at time t = 3 you feel uncomfortably hot. What happens to the temperature in each case? (a) f 0 (0) = 1, f 00 (0) = −2 (b) f 0 (0) = −1, f 00 (0) = 2 Page 2 of 4 MATH 131-503 Fall 2015 2.8 c Wen Liu 3. A graph of a population of yeast cells in a new laboratory culture as a function of time is given. At what point is the rate of population increase the greatest? 4. (p. 163) The graph of the derivative f 0 of a continuous function f is shown. (a) On what intervals is f increasing? Decreasing? (b) At what values of x does f have a local maximum? Local minimum? (c) On what intervals is f concave upward? Concave downward? Page 3 of 4 MATH 131-503 Fall 2015 2.8 c Wen Liu (d) Sate the x-coordinate(s) of the point(s) of inflection. (e) Assuming that f (0) = 0, sketch a graph of f . Page 4 of 4
