Notes: 3 Mar 2003 Charts/Graphs
advertisement
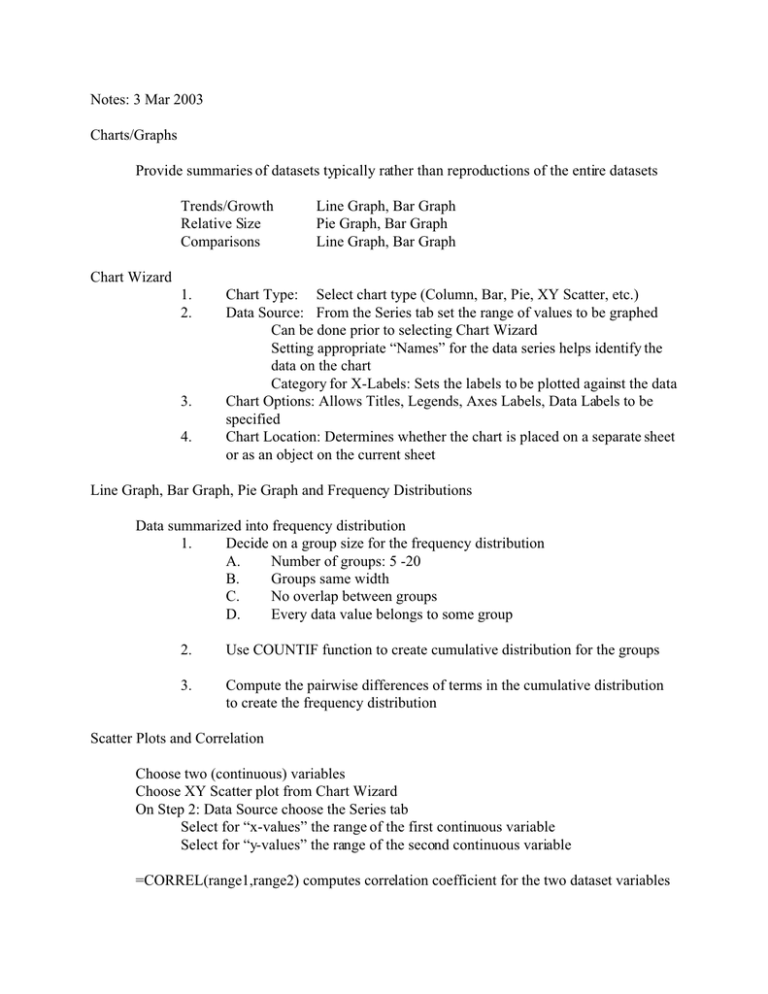
Notes: 3 Mar 2003 Charts/Graphs Provide summaries of datasets typically rather than reproductions of the entire datasets Trends/Growth Relative Size Comparisons Line Graph, Bar Graph Pie Graph, Bar Graph Line Graph, Bar Graph Chart Wizard 1. 2. 3. 4. Chart Type: Select chart type (Column, Bar, Pie, XY Scatter, etc.) Data Source: From the Series tab set the range of values to be graphed Can be done prior to selecting Chart Wizard Setting appropriate “Names” for the data series helps identify the data on the chart Category for X-Labels: Sets the labels to be plotted against the data Chart Options: Allows Titles, Legends, Axes Labels, Data Labels to be specified Chart Location: Determines whether the chart is placed on a separate sheet or as an object on the current sheet Line Graph, Bar Graph, Pie Graph and Frequency Distributions Data summarized into frequency distribution 1. Decide on a group size for the frequency distribution A. Number of groups: 5 -20 B. Groups same width C. No overlap between groups D. Every data value belongs to some group 2. Use COUNTIF function to create cumulative distribution for the groups 3. Compute the pairwise differences of terms in the cumulative distribution to create the frequency distribution Scatter Plots and Correlation Choose two (continuous) variables Choose XY Scatter plot from Chart Wizard On Step 2: Data Source choose the Series tab Select for “x-values” the range of the first continuous variable Select for “y-values” the range of the second continuous variable =CORREL(range1,range2) computes correlation coefficient for the two dataset variables


