Ph 3324 In-lab activity: Temperature Dependence of Conductivity in a Metal, a
advertisement

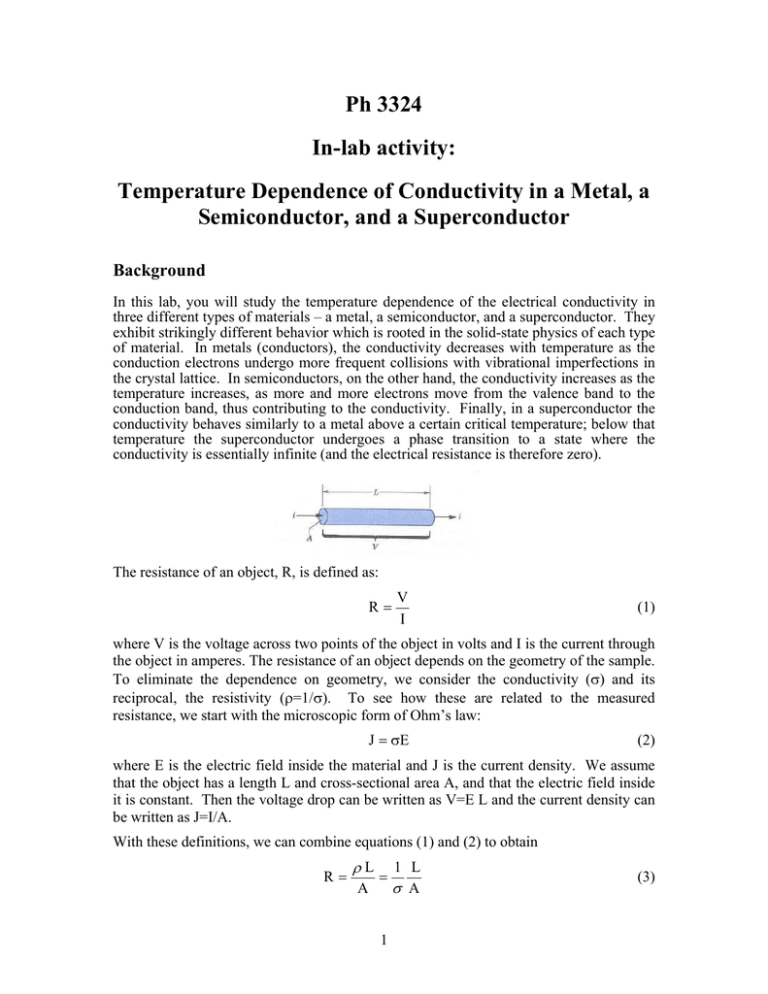
Ph 3324 In-lab activity: Temperature Dependence of Conductivity in a Metal, a Semiconductor, and a Superconductor Background In this lab, you will study the temperature dependence of the electrical conductivity in three different types of materials – a metal, a semiconductor, and a superconductor. They exhibit strikingly different behavior which is rooted in the solid-state physics of each type of material. In metals (conductors), the conductivity decreases with temperature as the conduction electrons undergo more frequent collisions with vibrational imperfections in the crystal lattice. In semiconductors, on the other hand, the conductivity increases as the temperature increases, as more and more electrons move from the valence band to the conduction band, thus contributing to the conductivity. Finally, in a superconductor the conductivity behaves similarly to a metal above a certain critical temperature; below that temperature the superconductor undergoes a phase transition to a state where the conductivity is essentially infinite (and the electrical resistance is therefore zero). The resistance of an object, R, is defined as: R V I (1) where V is the voltage across two points of the object in volts and I is the current through the object in amperes. The resistance of an object depends on the geometry of the sample. To eliminate the dependence on geometry, we consider the conductivity () and its reciprocal, the resistivity (=1/). To see how these are related to the measured resistance, we start with the microscopic form of Ohm’s law: J E (2) where E is the electric field inside the material and J is the current density. We assume that the object has a length L and cross-sectional area A, and that the electric field inside it is constant. Then the voltage drop can be written as V=E L and the current density can be written as J=I/A. With these definitions, we can combine equations (1) and (2) to obtain R L A 1 1 L A (3) Some background on the theory of electron conduction is described in Krane section 11.6. The result is that the conductivity () can be expressed as: ne 2 m (4) where the collision time, , is the average time between collisions with the lattice, n is the number density of free electrons, e is the charge of the electron, and m is the mass of the electron. The temperature dependence of the resistance comes from the temperature dependence of the conductivity. Since there has only been limited coverage of the necessary physics background to understand this in this course so far, we only give very brief (and incomplete) descriptions of how that temperature dependence comes about for metals and semiconductors. One important thing to know about is energy bands. When one has a large collection of identical atoms in a periodic lattice, the available energies to the electrons consist of dense bands of allowed energies separated by gaps of energy levels where electrons are forbidden to be (see figure below). Metallic conductors: Metallic conductors are defined by the fact that their highest filled energy band is only partially filled. Thus it is easy for the electrons in that band to move 2 about under the influence of an electric field by filling nearby energy levels. However, the electrons do dissipate some energy by collisions with the metal atom lattice due to thermal vibrations. The rate at which they scatter depends on their average velocity and therefore on the temperature. The classical prediction is that the conductivity varies as 1/ T , while the quantum mechanical prediction is that it varies as 1/T. So we expect the temperature dependence of the resistance in a metal to vary linearly with temperature (since the resistivity is inversely proportional to the conductivity). Therefore we expect: R Ro R0 (T T0 ) = C + D T (5) Semiconductor: A semiconductor is a material that has a full valence band but with a small enough energy gap between the valence and conduction bands to allow a nonnegligible conductivity. For a semiconductor, the main factor that causes the temperature dependence of the conductivity is the fact that the number density of free carrier electrons n (the ones in the conduction band) is an exponential function of temperature. You will learn in statistical physics that the probability of the conduction band being filled as a function of temperature is given by the Fermi-Dirac distribution, which we can approximate for our purposes as: f FD ~ e Eg 2k BT where f is the probability of an electron being in the conduction band, Eg is the energy gap between the valence and conduction band, Boltzmann's constant is kB = 8.617 x 10⁻⁵ eV/K, and T is the absolute temperature in Kelvin. This makes sense because the probability of the electron being the conduction band increases with temperature as one expects since there is more thermal energy available to excite the electron across the energy gap. With this, the final expression for the resistance can be written as: Eg R R oe 2k BT (6) Thus, the resistance decreases with increasing temperature, since there are more conduction electrons available as the temperature increases. Superconductor: For you final activity in this lab, you will look at the temperature dependence of the conductivity in a “high TC” superconductor, YBa2Cu3O7 , which goes superconducting (zero resistance) when it is cooled to a temperature called the superconducting transition temperature. You will also demonstrate the expulsion of magnetic field lines from a superconductor, known as the Meissner effect. 3 Procedure and Data Analysis 1. First sit at a table that has a platinum resistor (it is one of the ones labeled with the number 58680 on its side). Make sure the outputs are connected up to the digital multimeter and put it into resistance measuring mode. Insert the thermometer from the other side so that its tip will be near to the platinum wire on the inside of the oven. Ask your TA to check your setup before you start taking data. 2. Please read this entire paragraph before beginning to take data. You should prepare your data table before you start since the oven will heat up fairly quickly (you will be able to take all the data in about 10 minutes). You should note down the resistance at o whatever the current temperature is and then prepare a table in 10 C intervals (30, 40 ,.. o 160) up to 160 C. Turn the switch on and note the resistance and temperature values as the oven heats up. The outside of the oven will be warm to the touch. When the o temperature reaches 140 C, turn the switch off. The oven will continue to heat up, so o o take data up to 160 C. When the oven reaches 160 C remove the thermometer and resistor and lay them on the table to cool. DON’T touch the parts of the resistor and thermometer that were inside the oven! 3. Open Excel on the computer and make a quick plot of your data (resistance versus temperature). Based on the discussion earlier, you should see that the data shows a nice linear behavior versus temperature. Print out a copy of the plot for each student in the group and attach it at the end of this report. 4. Move to a table that has a semiconductor resistor (it is one of the ones labeled with the number 58682 on its side). The semiconductor resistor is inside the metal tube, so you can’t actually see it. Make sure the outputs are connected up to the digital multimeter and put it into resistance measuring mode. Insert the thermometer from the other side so that its tip will be near to the semiconductor resistor on the inside of the oven. Ask your TA to check your setup before you start taking data. 5. Please read this entire paragraph before beginning to take data. You should prepare your data table before you start since the oven will heat up fairly quickly (you will be able to take all the data in about 10 minutes). You should note down the resistance at o whatever the current temperature is and then prepare a table in 10 C intervals (30, 40 ,.. o 160) up to 160 C. Turn the switch on and note the resistance and temperature values as the oven heats up. The outside of the oven will be warm to the touch. When the o temperature reaches 140 C, turn the switch off. The oven will continue to heat up, so o o take data up to 160 C. When the oven reaches 160 C remove the thermometer and resistor and lay them on the table to cool. DON’T touch the parts of the semiconductor resistor and thermometer that were inside the oven! 4 5. Open Excel on the computer and make a quick plot of your data. You should see the resistance falling exponentially as the temperature increases. Print out a copy of the plot for each student and attach it at the end of this report. 6. Now you will do some more analysis on the semiconductor data to extract the bandgap energy for this semiconductor. Recall from the beginning of the lab that: Eg R R oe 2k BT If you take the natural log (ln) of each side, you get: E g 1 ln(R) ln(R o ) 2k B T so, if you plot ln(R) (on the y-axis) versus (1/T) (on the x-axis) then you should get a straight line with a slope that is (Eg /2 kB). Note that the temperature here needs to be in K (so you need to take all your temperature values in C and add 273.15). Perform the manipulations in Excel needed to prepare the data columns needed for this plot and then make the plot and do a linear fit to it to extract a value of the slope. Print out a copy of the plot for each student and attach it at the end of this report. Write down your fitted value of the slope: From this value of the slope, extract the bandgap energy Eg for your semiconductor. Recall that Boltzmann's constant kB = 8.617 x 10⁻⁵ eV/K. Show your work below. You should get a value of the bandgap energy that is within 30% of the value 0.48 eV, which is the accepted value for this particular material. 6. Superconductor: During the lab, the TA will call you over to a special station to show you what happens to the superconductor’s resistance as it passes through the superconducting transition temperature. At approximately what temperature does our superconductor change from behaving like an ordinary metal to having “zero” resistance? Write down the observed value here: 5


