Phase Averaged Characterization of Respiratory Sinus Arrhythmia Pattern
advertisement
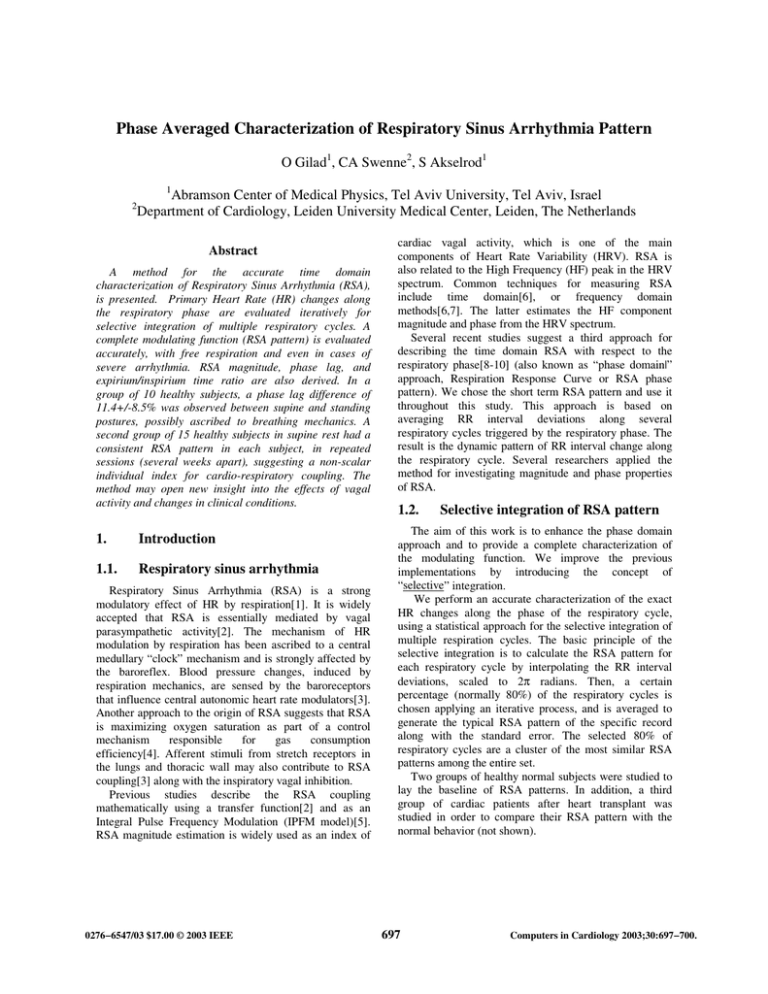
Phase Averaged Characterization of Respiratory Sinus Arrhythmia Pattern O Gilad1, CA Swenne2, S Akselrod1 1 2 Abramson Center of Medical Physics, Tel Aviv University, Tel Aviv, Israel Department of Cardiology, Leiden University Medical Center, Leiden, The Netherlands Abstract A method for the accurate time domain characterization of Respiratory Sinus Arrhythmia (RSA), is presented. Primary Heart Rate (HR) changes along the respiratory phase are evaluated iteratively for selective integration of multiple respiratory cycles. A complete modulating function (RSA pattern) is evaluated accurately, with free respiration and even in cases of severe arrhythmia. RSA magnitude, phase lag, and expirium/inspirium time ratio are also derived. In a group of 10 healthy subjects, a phase lag difference of 11.4+/-8.5% was observed between supine and standing postures, possibly ascribed to breathing mechanics. A second group of 15 healthy subjects in supine rest had a consistent RSA pattern in each subject, in repeated sessions (several weeks apart), suggesting a non-scalar individual index for cardio-respiratory coupling. The method may open new insight into the effects of vagal activity and changes in clinical conditions. 1. Introduction 1.1. Respiratory sinus arrhythmia Respiratory Sinus Arrhythmia (RSA) is a strong modulatory effect of HR by respiration[1]. It is widely accepted that RSA is essentially mediated by vagal parasympathetic activity[2]. The mechanism of HR modulation by respiration has been ascribed to a central medullary “clock” mechanism and is strongly affected by the baroreflex. Blood pressure changes, induced by respiration mechanics, are sensed by the baroreceptors that influence central autonomic heart rate modulators[3]. Another approach to the origin of RSA suggests that RSA is maximizing oxygen saturation as part of a control mechanism responsible for gas consumption efficiency[4]. Afferent stimuli from stretch receptors in the lungs and thoracic wall may also contribute to RSA coupling[3] along with the inspiratory vagal inhibition. Previous studies describe the RSA coupling mathematically using a transfer function[2] and as an Integral Pulse Frequency Modulation (IPFM model)[5]. RSA magnitude estimation is widely used as an index of 0276−6547/03 $17.00 © 2003 IEEE cardiac vagal activity, which is one of the main components of Heart Rate Variability (HRV). RSA is also related to the High Frequency (HF) peak in the HRV spectrum. Common techniques for measuring RSA include time domain[6], or frequency domain methods[6,7]. The latter estimates the HF component magnitude and phase from the HRV spectrum. Several recent studies suggest a third approach for describing the time domain RSA with respect to the respiratory phase[8-10] (also known as “phase domain|” approach, Respiration Response Curve or RSA phase pattern). We chose the short term RSA pattern and use it throughout this study. This approach is based on averaging RR interval deviations along several respiratory cycles triggered by the respiratory phase. The result is the dynamic pattern of RR interval change along the respiratory cycle. Several researchers applied the method for investigating magnitude and phase properties of RSA. 1.2. Selective integration of RSA pattern The aim of this work is to enhance the phase domain approach and to provide a complete characterization of the modulating function. We improve the previous implementations by introducing the concept of “selective” integration. We perform an accurate characterization of the exact HR changes along the phase of the respiratory cycle, using a statistical approach for the selective integration of multiple respiration cycles. The basic principle of the selective integration is to calculate the RSA pattern for each respiratory cycle by interpolating the RR interval deviations, scaled to 2π radians. Then, a certain percentage (normally 80%) of the respiratory cycles is chosen applying an iterative process, and is averaged to generate the typical RSA pattern of the specific record along with the standard error. The selected 80% of respiratory cycles are a cluster of the most similar RSA patterns among the entire set. Two groups of healthy normal subjects were studied to lay the baseline of RSA patterns. In addition, a third group of cardiac patients after heart transplant was studied in order to compare their RSA pattern with the normal behavior (not shown). 697 Computers in Cardiology 2003;30:697−700. Materials and methods 2.1. Subjects and data acquisition Group 1: first normal group including 10 healthy subjects, 4 men and 6 women, age 24 to 37, (mean±std) 29±4.1 years. This data set is a control group taken from another study in our group[11]. Signals were sampled simultaneously at 500Hz, using a Biopac multi-channel device with Acknowledge software (MP100-BIOPAC system). ECG (leads I and II) was recorded along with the respiratory signal (Respitrace Pneumoplethysmograph Rib and Abdomen impedance belts). The Respitrace measures a voltage proportional to chest cage contour. Breathing rate and depth were spontaneous. The protocol included 30min quiet, supine rest followed by several autonomic stimuli (MVC Isometric Handgrip, active change in posture from supine to standing and 5min recording in standing posture. For the purposes of our RSA pattern study, we used supine rest session and standing session. We ignored the first 5min of the supine session and the first min after transition to standing, for obtaining steady state recordings. The purpose of this data set was to demonstrate the differences of RSA patterns between postures. Group 2: second normal group including 15 healthy male subjects, age (mean±std) 25.9±3.7 years. This data set is taken from a study on improvement of baroreflex sensitivity by sensory stimulation to the feet (assumed not to affect RSA pattern estimation)[12]. ECG (leads I, II and V3) was recorded at 500Hz along with 2 extra electrodes applied to the lateral sides of the thorax in order to monitor respiration (impedance method). Protocol included 60min of supine rest on 3 measurement days: A, B and C. Day B was one day after A, and day C was several weeks apart. Sensory stimulation was applied to both feet on days A and B and not in day C. The purpose of this data set was to demonstrate the consistency of the RSA pattern along several weeks time, as well as the individual differences among subjects. 2.2. Extracting RSA pattern QRS complex was detected from lead II using a threshold and manual correction method followed by a squared interpolation to refine time estimation. Time series representing the onset of expiration were extracted from the respiration signals by similar procedure. Triangular window smoothing filter was applied prior to detection. The onset of expirium is represented by maxima in group 1 and by minima in group 2 due to the different devices used. Poor respiratory signal quality in some of group 2 recordings (impedance method) reduced the reliable recordings for analysis from 15 to 7. Calculation of RSA pattern was initiated with resampling the RR interval vector using the MATLAB interp1 cubic spline utility into R=50 points in each respiratory cycle (every respiratory cycle T, has a different sampling time which equals T/R). All respiration cycles were displayed and shown upon each other on the same scale so that R represents 2π. An iterative process was used to calculate the cluster containing 80% of the respiratory cycles, which are the closest to the RSA pattern in a mean square sense and maxima location (Fig. 1). The algorithm repetitively evaluates a mean RSA pattern, ignores 10% of the cycles with the highest deviation from mean and 10% with the highest deviation of the maxima location. Up to 6 (Typically 3 or 4) iterations are required before convergence to the dominant RSA pattern. The DC component representing 1/HR was subtracted. The 20% outliers can be related to any non-stationary behavior of the Heart-Lung system such as: Low Frequency (LF) components, HR arrhythmia, or simply very long breaths, instant breathing interruption or saliva swallowing. 100 50 RRI Deviation (ms) 2. 0 −50 −100 0 π Res piration P ha s e (rad) 2π Figure 1. Iterative evaluation cluster containing 80% of respiratory cycles (solid), representing the primary RSA pattern (Normal subject at supine rest). The 20% outliers are also shown (dashed). Standard error of the selected 80% was estimated along the final RSA pattern (Fig. 2). Typical values for the vertical error were around 6% to 8% of the RSA pattern magnitude for 30 to 60min records and 15% to 24% for 5 to 10min records). Horizontal phase resolution was estimated theoretically to be above 0.2rad and measured to be 0.5rad, partly due to the physiological bandwidth limit. These figures were derived and estimated using SNR, bandwidth, integration and practical considerations. Sensitivity of the method to respiratory related frequencies is 1% for 5min recording. HRV components further away from that value will vanish throughout the integration procedure. 698 Table 1. Group 1: statistical measurements (mean±std) 100 Posture HR [BPM] Respiration Rate [BPM] RSA Magnitude [ms]1 Error of RSA pattern [ms] RSA Maxima Location [Rad] RSA Minima Location [Rad] RSA Inspirium Length [Rad]2 RRI Deviatoin (ms) 50 0 RSA Inspirium Length [Rad]3 −50 Supine 63±6 16.9±3.3 81±41 4.7±3.2 2.9±0.3 6.1±0.3 3.2±0.4 (51%) 3.3±0.3 (53%) Standing 77±8 17.1±1.7 39±30 8.6±3.4 3.7±0.5 0.2±0.4 2.8±0.6 (45%) 2.6±0.5 (42%) 1 Calc. peak to peak; 2 Calc. with RSA pattern Min/Max ; 3 Calc. with RSA pattern Max. and expirium onset trigger. −100 0 π Re spiration Pha se (ra d) 100 2π 3. RRI Deviatoin (ms) Figure 2. Final RSA pattern and error estimation of normal subject in supine rest (solid), and standing (dashdot). The error estimation is shown (dotted). Magnitude and phase differences are clearly seen. Zero phase represents the onset of expirium. Results Group 1: Typical RSA pattern in supine and standing sessions is presented in Fig. 1. As expected, instantaneous HR increased during inspirium and decreased during expirium. Table 1 summarizes statistical measurements derived. The RSA magnitude while standing was significantly lower than supine, by an average of 48% (std=35%, P<0.006, Wilcoxon Signed Rank Test (WSRT)). The phase of the RSA pattern maxima while standing was significantly shifted to the right compared to supine posture. The phase shift was 11.4% of the respiration period, from 2.9Rad to 3.7Rad (std=8.5%, P<0.004, WSRT). Expirium duration changed from 49% to 55% (p<0.06, WSRT) of the respiration period when computed from the difference between the RSA pattern maxima and minima. and from 47% to 58% (p<0.04, WSRT) when computed from the difference between the RSA pattern maxima and expirium onset trigger. The mean error of the RSA pattern estimate averaged to 4.7ms while supine and 8.6ms while standing (due to shorter standing session). Group 2: Typical RSA patterns of two subjects from sessions A,B and C is presented in Fig. 3. The RSA magnitude and pattern remain approximately the same for sessions A, B and C. This may suggest a long term consistency of the RSA pattern as a non-scalar index of vagal activity. Only 1 of the 7 subjects in the selected group showed a variable RSA pattern along time. Statistical measurements showed no significant difference between the three sessions supporting the consistency hypothesis. Grouped mean maxima location for the three sessions was 3.29 ± 0.47rad. 50 0 −50 −100 0 π Res piration P ha se (rad) 2π Figure 3. RSA pattern of subject 4 (solid) and subject 10 (dashed) at three sessions (A,B and C). The difference among subjects and the long-term consistency within each subject is presented. 4. Discussion We have used two groups of healthy normal subjects in order to lay the baseline of RSA patterns. In the first group we obtained a significant 48% magnitude and 11.4% right shift phase lag when comparing supine and standing postures. The phase difference may be ascribed to mechanical differences between supine and standing breathing patterns, resulting in different chest diameter changes pattern as measured by the Respitrace Pneumoplethysmograph instrument. In addition, the 6-9% increase in the expiration period (increased E/I ration) corresponds with the mechanics of respiration. Expirium is characterized by air flowing out from the lung spontaneously without any muscular activity involved (as opposed to inspirium). While standing, the diaphragm must move upward spontaneously against the simple gravitational force pulling the viscera downward (comparing to supine) the 699 expirium will then take longer increasing the E/I ratio. In the second group, we may have found first evidences for long-term consistency of RSA pattern obtained from sessions several weeks apart. This consistency effect should be further investigated for longer time between sessions in order to validate possible applications for RSA pattern as a new non-scalar index of vagal activity. Consistent individual features over one year were observed in the past using circulatory power spectra[13]. Consistency could be used as a research tool for long-term changes of a subjects RSA pattern behavior, such as response for drug treatment, recovery from disease or autonomic changes due to exercise. We have also observed possible subject specific RSA pattern characterization, which give rise to a possible “fingerprint” effect. This may lead to some interesting research applications such as trying to correlate the subjects specific RSA pattern with other autonomic functional characteristics in order to achieve better understanding of autonomous control. When comparing the maxima location in the supine session of group 1 (2.9±0.3rad, pneumoplethysmograph method) and group 2 (3.3±0.5rad, impedance method), we obtain a difference of 0.4rad, (6.7%). This is ascribed to the different recording instrumentation. The absolute phase of the RSA pattern is dependent on respiration recording method, and may cause variations in the order of 0.5rad. Hence, physiological interpretation of the absolute phase should be considered with caution. Considering the drawbacks of the suggested method, at least 5min of stationary recording are required for reasonable error. Dinh[10] suggested breath by breath short time analysis of RSA pattern. However, according to our results, single breath RSA pattern has a very lowresolution limitation that may obscure valuable information. In addition, 20% of the respiratory cycles are ignored and may contain important information. Finally, the method requires simultaneous recording of ECG and respiration. This may limit future clinical applications. In conclusion, the time domain RSA pattern characterization is a complementary tool to the frequency domain and statistical methods. It may open an exciting insight into the effects of vagal activity, as well as into changes in clinical condition, in specific cardiac or respiratory diseases (yet to be explored). [2] Saul JP, Berger RD, Albrecht P, Stein SP, Chen MH, Cohen RJ. Transfer function analysis of the circulation: unique insights into cardiovascular regulation. Am J Physiol 1991; 261(4 Pt 2):H1231-H1245 [3] Piepoli M, Sleight P, Leuzzi S, Valle F, Spadacini G, Passino C et al. Origin of respiratory sinus arrhythmia in conscious humans. An important role for arterial carotid baroreceptors. Circulation 1997; 95(7):1813-1821 [4] Giardino ND, Glenny RW, Borson S, Chan L. Respiratory sinus arrhythmia is associated with efficiency of pulmonary gas exchange in healthy humans. Am J Physiol Heart Circ Physiol 2003; 284(5):H1585-H1591 [5] Bayly EJ. Spectral analysis of pulse frequency modulation in the nervous systems. IEEE Trans Biomed Eng 1968; 15(4):257-265 [6] Grossman P, van Beek J, Wientjes C. A comparison of three quantification methods for estimation of respiratory sinus arrhythmia. Psychophysiology 1990; 27(6):702-714 [7] Akselrod S, Gordon D, Ubel FA, Shannon DC, Berger AC, Cohen RJ. Power spectrum analysis of heart rate fluctuation: a quantitative probe of beat-to-beat cardiovascular control. Science 1981; 213(4504):220-222 [8] Kotani K, Hidaka I, Yamamoto Y, Ozono S. Analysis of respiratory sinus arrhythmia with respect to respiratory phase. Methods Inf Med 2000; 39(2):153-156 [9] Niizeki K, Kawahara K, Miyamoto Y. Cardiac, respiratory, and locomotor coordination during walking in humans. Folia Primatol (Basel) 1996; 66(1-4):226-239 [10] Dinh TP, Perrault H, Calabrese P, Eberhard A, Benchetrit G. New statistical method for detection and quantification of respiratory sinus arrhythmia. IEEE Trans Biomed Eng 1999; 46(9):1161-1165 [11] Davrath LR, Goren Y, Pinhas I, Toledo E, Akselrod S. Early Autonomic Malfunction in Normotensive Individuals with a Genetic Predisposition to Essential Hypertension. Am J Physiol Heart Circ Physiol 2003; [12] Frederiks J, Swenne CA, Ghafoerkhan A, Lalmahomed H, Maan AC, Schalij MJ et al. Rhythmic sensory stimulation improves fitness by conditioning the autonomic nervous system. Netherlands Heart J 2002; 10:43-47 [13] Honzikova N, Penaz J, Fiser B. Individual features of circulatory power spectra in man. Eur J Appl Physiol Occup Physiol 1990; 59(6):430-434 Address for correspondence. Prof. Solange Akselrod The Abramson Center of Medical Physics, Sackler Faculty of Exact Sciences, Tel Aviv University, Tel Aviv 69978, Israel Solange@post.tau.ac.il Acknowledgements The authors thank LR Davrath and Y Goren for providing the normal subjects data set ( group 1). References [1] Bernardi L, Porta C, Gabutti A, Spicuzza L, Sleight P. Modulatory effects of respiration. Auton Neurosci 2001; 90(1-2):47-56 700
