NJDOE MODEL CURRICULUM PROJECT CORRESPONDING # STUDENT LEARNING OBJECTIVES
advertisement
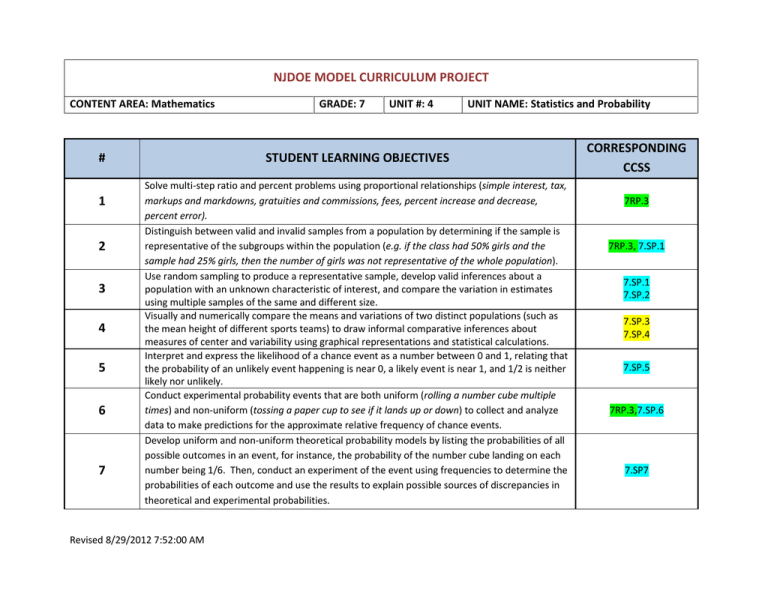
NJDOE MODEL CURRICULUM PROJECT CONTENT AREA: Mathematics # 1 2 3 4 5 6 7 GRADE: 7 UNIT #: 4 UNIT NAME: Statistics and Probability STUDENT LEARNING OBJECTIVES Solve multi-step ratio and percent problems using proportional relationships (simple interest, tax, markups and markdowns, gratuities and commissions, fees, percent increase and decrease, percent error). Distinguish between valid and invalid samples from a population by determining if the sample is representative of the subgroups within the population (e.g. if the class had 50% girls and the sample had 25% girls, then the number of girls was not representative of the whole population). Use random sampling to produce a representative sample, develop valid inferences about a population with an unknown characteristic of interest, and compare the variation in estimates using multiple samples of the same and different size. Visually and numerically compare the means and variations of two distinct populations (such as the mean height of different sports teams) to draw informal comparative inferences about measures of center and variability using graphical representations and statistical calculations. Interpret and express the likelihood of a chance event as a number between 0 and 1, relating that the probability of an unlikely event happening is near 0, a likely event is near 1, and 1/2 is neither likely nor unlikely. Conduct experimental probability events that are both uniform (rolling a number cube multiple times) and non-uniform (tossing a paper cup to see if it lands up or down) to collect and analyze data to make predictions for the approximate relative frequency of chance events. Develop uniform and non-uniform theoretical probability models by listing the probabilities of all possible outcomes in an event, for instance, the probability of the number cube landing on each number being 1/6. Then, conduct an experiment of the event using frequencies to determine the probabilities of each outcome and use the results to explain possible sources of discrepancies in theoretical and experimental probabilities. Revised 8/29/2012 7:52:00 AM CORRESPONDING CCSS 7RP.3 7RP.3, 7.SP.1 7.SP.1 7.SP.2 7.SP.3 7.SP.4 7.SP.5 7RP.3,7.SP.6 7.SP7 NJDOE MODEL CURRICULUM PROJECT CONTENT AREA: Mathematics 8 GRADE: 7 UNIT #: 4 UNIT NAME: Statistics and Probability Design a simulation of a compound probability event and determine the sample space using organized lists, tables, and tree diagrams, calculate the fractional probabilities for each outcome in the sample space, and conduct the simulation using the data collected to determine the frequencies of the outcomes in the sample space. Major Content Supporting Content Additional Content (Identified by PARCC Model Content Frameworks). Bold type indicates grade level fluency requirements. (Identified by PARCC Model Content Frameworks). Selected Opportunities for Connection to Mathematical Practices 1. Make sense of problems and persevere in solving them. SLO 1 Use problems that have several givens or must be decomposed before solving. 2. Reason abstractly and quantitatively. SLO 2 Present an argument and provide supporting justification 3. Construct viable arguments and critique the reasoning of others. 4. Model with mathematics. SLO 5 Determine probability experimentally. 5. Use appropriate tools strategically. 6. Attend to precision. 7. Look for and make use of structure. 8. Look for and express regularity in repeated reasoning. All of the content presented at this grade level has connections to the standards for mathematical practices. Bold type identifies possible starting points for connections to the SLOs in this unit. Revised 8/29/2012 7:52:00 AM 7.SP.8 NJDOE MODEL CURRICULUM PROJECT CONTENT AREA: Mathematics Code # 7.RP.3 7.SP.1 7.SP.2 7.SP.3 7.SP.4 7.SP.5 7.SP.6 7.SP.7 GRADE: 7 UNIT #: 4 UNIT NAME: Statistics and Probability Common Core State Standards Use proportional relationships to solve multistep ratio and percent problems. Examples: simple interest, tax, markups and markdowns, gratuities and commissions, fees, percent increase and decrease, percent error. Understand that statistics can be used to gain information about a population by examining a sample of the population; generalizations about a population from a sample are valid only if the sample is representative of that population. Understand that random sampling tends to produce representative samples and support valid inferences. Use data from a random sample to draw inferences about a population with an unknown characteristic of interest. Generate multiple samples (or simulated samples) of the same size to gauge the variation in estimates or predictions. For example, estimate the mean word length in a book by randomly sampling words from the book; predict the winner of a school election based on randomly sampled survey data. Gauge how far off the estimate or prediction might be. Informally assess the degree of visual overlap of two numerical data distributions with similar variabilities, measuring the difference between the centers by expressing it as a multiple of a measure of variability. For example, the mean height of players on the basketball team is 10 cm greater than the mean height of players on the soccer team, about twice the variability (mean absolute deviation) on either team; on a dot plot, the separation between the two distributions of heights is noticeable. Use measures of center and measures of variability for numerical data from random samples to draw informal comparative inferences about two populations. For example, decide whether the words in a chapter of a seventh-grade science book are generally longer than the words in a chapter of a fourth-grade science book. Understand that the probability of a chance event is a number between 0 and 1 that expresses the likelihood of the event occurring. Larger numbers indicate greater likelihood. A probability near 0 indicates an unlikely event, a probability around 1/2 indicates an event that is neither unlikely nor likely, and a probability near 1 indicates a likely event. Approximate the probability of a chance event by collecting data on the chance process that produces it and observing its long-run relative frequency, and predict the approximate relative frequency given the probability. For example, when rolling a number cube 600 times, predict that a 3 or 6 would be rolled roughly 200 times, but probably not exactly 200 times. Develop a probability model and use it to find probabilities of events. Compare probabilities from a model to observed frequencies; if the agreement is not good, explain possible sources of the discrepancy. a. Develop a uniform probability model by assigning equal probability to all outcomes, and use the model to determine Revised 8/29/2012 7:52:00 AM NJDOE MODEL CURRICULUM PROJECT CONTENT AREA: Mathematics GRADE: 7 UNIT #: 4 UNIT NAME: Statistics and Probability probabilities of events. For example, if a student is selected at random from a class, find the probability that Jane will be selected and the probability that a girl will be selected. b. Develop a probability model (which may not be uniform) by observing frequencies in data generated from a chance process. For example, find the approximate probability that a spinning penny will land heads up or that a tossed paper cup will land open-end down. Do the outcomes for the spinning penny appear to be equally likely based on the observed frequencies Find probabilities of compound events using organized lists, tables, tree diagrams, and simulation. a. Understand that, just as with simple events, the probability of a compound event is the fraction of outcomes in the sample space for which the compound event occurs. b. Represent sample spaces for compound events using methods such as organized lists, tables and tree diagrams. For an 7.SP.8 event described in everyday language (e.g., “rolling double sixes”), identify the outcomes in the sample space which compose the event. c. Design and use a simulation to generate frequencies for compound events. For example, use random digits as a simulation tool to approximate the answer to the question: If 40% of donors have type A blood, what is the probability that it will take at least 4 donors to find one with type A blood? Major Content Supporting Content Additional Content (Identified by PARCC Model Content Frameworks). Bold type indicates grade level fluency requirements. (Identified by PARCC Model Content Frameworks). Revised 8/29/2012 7:52:00 AM
