SECTION 3.1 - MEASURES OF CENTRAL TENDENCY
advertisement

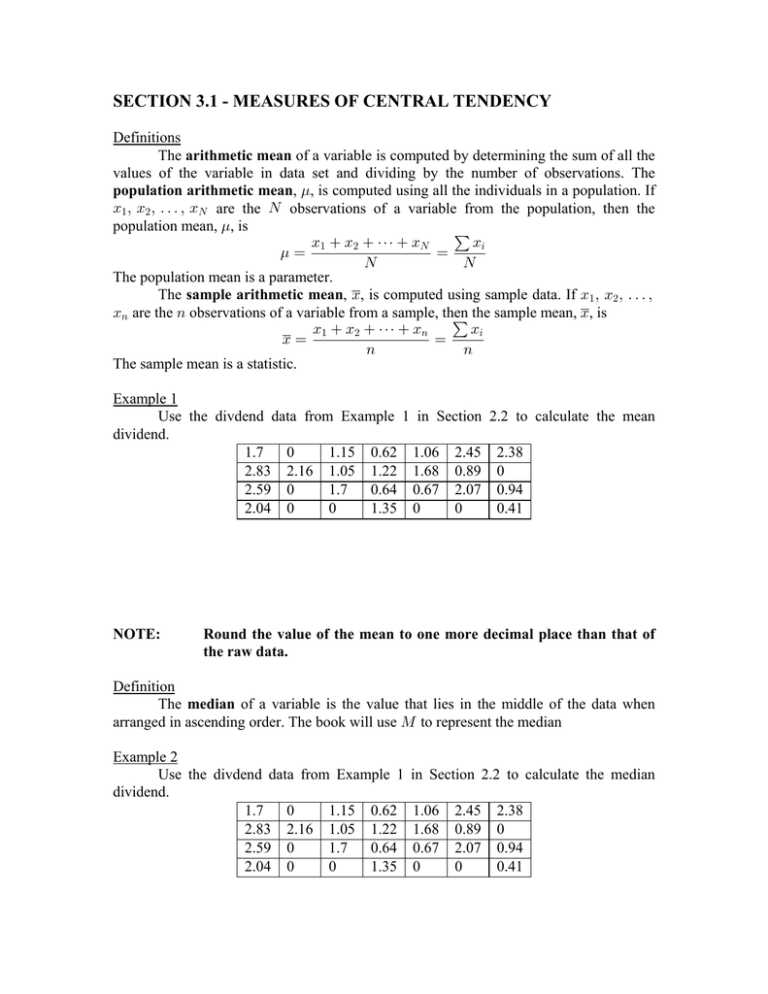
SECTION 3.1 - MEASURES OF CENTRAL TENDENCY Definitions The arithmetic mean of a variable is computed by determining the sum of all the values of the variable in data set and dividing by the number of observations. The population arithmetic mean, ., is computed using all the individuals in a population. If B" ß B# ß Þ Þ Þ ß BR are the R observations of a variable from the population, then the population mean, ., is B3 B" B# â BR .œ œ R R The population mean is a parameter. The sample arithmetic mean, B, is computed using sample data. If B" ß B# ß Þ Þ Þ ß B8 are the 8 observations of a variable from a sample, then the sample mean, B, is B3 B" B# â B8 Bœ œ 8 8 The sample mean is a statistic. Example 1 Use the divdend data from Example 1 in Section dividend. 1.7 0 1.15 0.62 1.06 2.45 2.83 2.16 1.05 1.22 1.68 0.89 2.59 0 1.7 0.64 0.67 2.07 2.04 0 0 1.35 0 0 NOTE: 2.2 to calculate the mean 2.38 0 0.94 0.41 Round the value of the mean to one more decimal place than that of the raw data. Definition The median of a variable is the value that lies in the middle of the data when arranged in ascending order. The book will use Q to represent the median Example 2 Use the divdend data from Example 1 dividend. 1.7 0 1.15 0.62 2.83 2.16 1.05 1.22 2.59 0 1.7 0.64 2.04 0 0 1.35 in Section 2.2 to calculate the median 1.06 1.68 0.67 0 2.45 0.89 2.07 0 2.38 0 0.94 0.41 Definitions The mode of a variable is the most frequent observation of the variable that occurs in the data set. If no observation occurs more than once, the data set has no mode. If the data set has two modes, the data is said to be bimodal, and if the data set has three or more modes, it is said to be multimodal. Example 3 Use the divdend data from Example 1 in Section 2.2 to calculate the mode. 1.7 0 1.15 0.62 1.06 2.45 2.38 2.83 2.16 1.05 1.22 1.68 0.89 0 2.59 0 1.7 0.64 0.67 2.07 0.94 2.04 0 0 1.35 0 0 0.41 Definition A numerical summary of data is said to be resistant if extreme values (very large or small) relative to the data do not affect its value substantially. Relation Between the Mean, Median, and Distribution Shape Distribution Shape Mean versus Median Skewed left Mean substantially smaller than median Symmetric Mean roughly equal to median Skewed right Mean substantially larger than median


