1 Normal Probability Distributions Chapter 6
advertisement
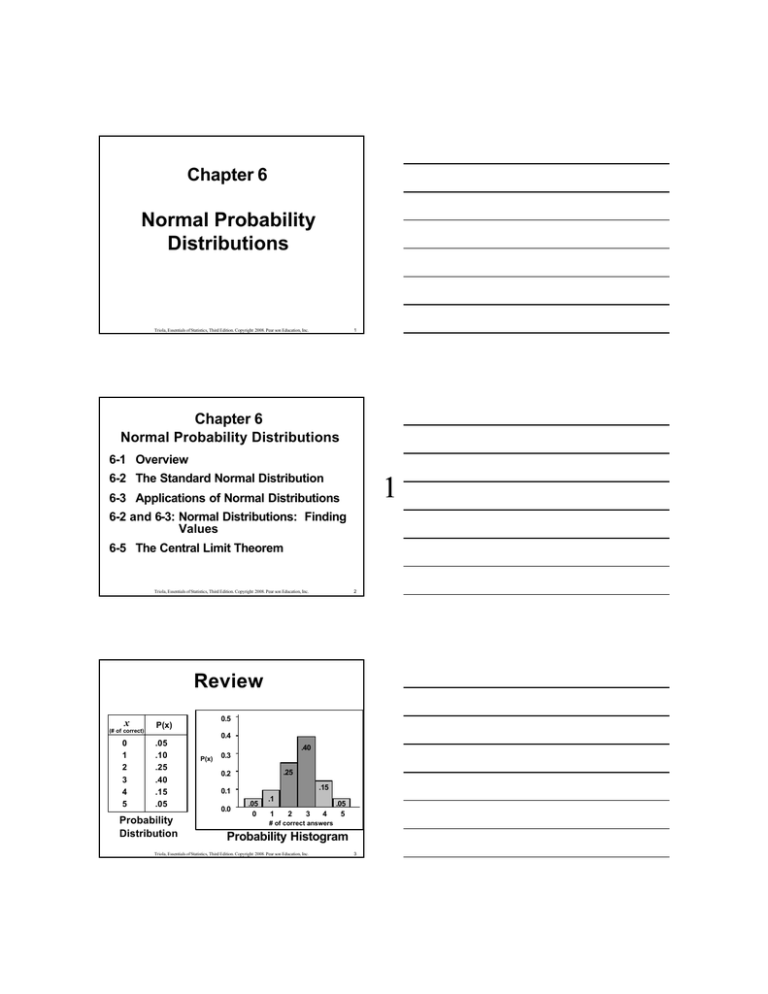
Chapter 6 Normal Probability Distributions 1 Triola,, Essentials of Statistics, Third Edition. Copyright 2008. Pear son Education, Inc. Triola Chapter 6 Normal Probability Distributions 6-1 Overview 6-2 The Standard Normal Distribution 1 6-3 Applications of Normal Distributions 6-2 and 66-3: Normal Distributions: Finding Values 6-5 The Central Limit Theorem 2 Triola,, Essentials of Statistics, Third Edition. Copyright 2008. Pear son Education, Inc. Triola Review x (# of correct) 0 1 2 3 4 5 0.5 P(x) .05 .10 .25 .40 .15 .05 Probability Distribution 0.4 .40 P(x) 0.3 .25 0.2 .15 0.1 0.0 .05 0 .1 1 2 3 4 .05 5 # of correct answers Probability Histogram Triola,, Essentials of Statistics, Third Edition. Copyright 2008. Pear son Education, Inc. Triola 3 Overview v Continuous random variable v Normal distribution 4 Triola,, Essentials of Statistics, Third Edition. Copyright 2008. Pear son Education, Inc. Triola Overview v Continuous random variable v Normal distribution 2 Curve is bell shaped and symmetric Figure 5 -1 µ Score 5 Triola,, Essentials of Statistics, Third Edition. Copyright 2008. Pear son Education, Inc. Triola Overview v Continuous random variable v Normal distribution Curve is bell shaped and symmetric Figure 6 -1 µ Score Formula 66-1 y= e 1 2 σ ( xσ- µ ) 2 2π Triola,, Essentials of Statistics, Third Edition. Copyright 2008. Pear son Education, Inc. Triola 6 6- 2 The Standard Normal Distribution Triola,, Essentials of Statistics, Third Edition. Copyright 2008. Pear son Education, Inc. Triola 7 Definitions v Density Curve (or probability density function) the graph of a continuous probability distribution Triola,, Essentials of Statistics, Third Edition. Copyright 2008. Pear son Education, Inc. Triola 3 8 Definitions v Density Curve (or probability density function) the graph of a continuous probability distribution 1. The total area under the curve must equal 1. 2. Every point on the curve must have a vertical height that is 0 or greater. Triola,, Essentials of Statistics, Third Edition. Copyright 2008. Pear son Education, Inc. Triola 9 Because the total area under the density curve is equal to 1, there is a correspondence between area and probability probability.. Triola,, Essentials of Statistics, Third Edition. Copyright 2008. Pear son Education, Inc. Triola 10 Definition v Uniform Distribution a probability distribution in which the continuous random variable values are spread evenly over the range of possibilities; the graph results in a rectangular shape. Triola,, Essentials of Statistics, Third Edition. Copyright 2008. Pear son Education, Inc. Triola 4 11 Uniform Distributions P( 1º < x < 4º ) = P(x ) 3 0.2 x 0 0 1 2 3 4 5 Temperature (degrees Celsius) Triola,, Essentials of Statistics, Third Edition. Copyright 2008. Pear son Education, Inc. Triola 12 Uniform Distributions Shaded Area = L • W = 3 • 0.2 = 0.6 P( 1º < x < 4º ) = 0.6 P(x ) 3 0.2 x 0 0 1 2 3 4 5 Temperature (degrees Celsius) 13 Triola,, Essentials of Statistics, Third Edition. Copyright 2008. Pear son Education, Inc. Triola Uniform Distributions P( 1º < x < 4º ) = 0.6 P(x ) P( x > 1º ) = 5 P(x ) 3 0.2 0.2 x 0 0 1 2 3 4 x 0 5 0 Temperature (degrees Celsius) 1 2 3 4 5 Temperature (degrees Celsius) 14 Triola,, Essentials of Statistics, Third Edition. Copyright 2008. Pear son Education, Inc. Triola Uniform Distributions Shaded Area = L • W = 4 • 0.2 = 0.8 P( 1º < x < 4º ) = 0.6 P(x ) P( x > 1º ) = 0.8 P(x ) 3 0.2 0.2 x 0 0 1 2 3 4 5 Temperature (degrees Celsius) x 0 0 1 2 3 4 5 Temperature (degrees Celsius) Triola,, Essentials of Statistics, Third Edition. Copyright 2008. Pear son Education, Inc. Triola 15 Heights of Adult Men and Women Women: µ = 63.6 σ = 2.5 Men: µ = 69.0 σ = 2.8 63.6 Figure 5 -4 69.0 Height (inches) 16 Triola,, Essentials of Statistics, Third Edition. Copyright 2008. Pear son Education, Inc. Triola Normal Distributions Different Locations µ = 25 µ = 100 µ = 100 σ=8 σ =8 σ=8 Same Shape 0 25 50 Same Location µ = 100 σ = 15 75 100 125 6 Different Shapes 150 175 Triola,, Essentials of Statistics, Third Edition. Copyright 2008. Pear son Education, Inc. Triola 17 Definition Standard Normal Distribution a normal probability distribution that has a mean of 0 and a standard deviation of 1, 1 , and the total area under its density curve is equal to 1. -3 -2 -1 0 1 2 3 Triola,, Essentials of Statistics, Third Edition. Copyright 2008. Pear son Education, Inc. Triola 18 Example: If thermometers have an average (mean) reading of 0 degrees and a standard deviation of 1 degree for freezing water and if one thermometer is randomly selected, find the probability that it reads freezing water is less than 1.58 degrees. µ =0 σ=1 P(zz < 1.58) = ? P( Triola,, Essentials of Statistics, Third Edition. Copyright 2008. Pear son Education, Inc. Triola 19 Methods for Finding Normal Distribution Areas vTable AA-2 (sometimes called zzdistribution or zz -table) 7 vSTATDISK vOther computer programs vTI TI--83/84 Calculator Triola,, Essentials of Statistics, Third Edition. Copyright 2008. Pear son Education, Inc. Triola 20 Table AA -2 vFormulas and Tables card v Appendix Triola,, Essentials of Statistics, Third Edition. Copyright 2008. Pear son Education, Inc. Triola 21 NEGATIVE Z Scores Table AA-2 Triola,, Essentials of Statistics, Third Edition. Copyright 2008. Pear son Education, Inc. Triola 22 Table AA -2 v Designed only for standard normal distribution v Is on two pages: negative z -scores and positive z-scores 8 v Body of table is a cumulative area from the left up to a vertical boundary v Avoid confusion between zz-scores and areas v Z-score hundredths is across the top row Triola,, Essentials of Statistics, Third Edition. Copyright 2008. Pear son Education, Inc. Triola 23 Table AA-2 Standard Normal Distribution Negative z-scores: cumulative from left x z 0 Triola,, Essentials of Statistics, Third Edition. Copyright 2008. Pear son Education, Inc. Triola 24 Table AA-2 Standard Normal Distribution Positive zz -scores: cumulative from left X z 25 Triola,, Essentials of Statistics, Third Edition. Copyright 2008. Pear son Education, Inc. Triola Table AA-2 Standard Normal Distribution µ=0 σ=1 9 z=x-µ σ X z 26 Triola,, Essentials of Statistics, Third Edition. Copyright 2008. Pear son Education, Inc. Triola Table AA-2 Standard Normal Distribution µ=0 σ=1 z=x-0 1 X z Triola,, Essentials of Statistics, Third Edition. Copyright 2008. Pear son Education, Inc. Triola 27 Table AA-2 Standard Normal Distribution µ=0 σ=1 z=x X z Triola,, Essentials of Statistics, Third Edition. Copyright 2008. Pear son Education, Inc. Triola 28 Table AA-2 Standard Normal Distribution µ=0 σ=1 10 z=x Area = Probability X z Triola,, Essentials of Statistics, Third Edition. Copyright 2008. Pear son Education, Inc. Triola 29 To find: z Score the distance along horizontal scale of the standard normal distribution; refer to the leftmost column and top row of Table AA-2 Area the region under the curve; refer to the values in the body of Table AA-2 Triola,, Essentials of Statistics, Third Edition. Copyright 2008. Pear son Education, Inc. Triola 30 Example: If thermometers have an average (mean) reading of 0 degrees and a standard deviation of 1 degree for freezing water and if one thermometer is randomly selected, find the probability that it reads freezing water is less than 1.58 degrees. µ =0 σ=1 P(zz < 1.58) = ? P( Triola,, Essentials of Statistics, Third Edition. Copyright 2008. Pear son Education, Inc. Triola 31 POSITIVE z Scores 11 Triola,, Essentials of Statistics, Third Edition. Copyright 2008. Pear son Education, Inc. Triola 32 POSITIVE z Scores Triola,, Essentials of Statistics, Third Edition. Copyright 2008. Pear son Education, Inc. Triola 33 Example: If thermometers have an average (mean) reading of 0 degrees and a standard deviation of 1 degree for freezing water and if one thermometer is randomly selected, find the probability that it reads freezing water is less than 1.58 degrees. µ =0 σ=1 P(zz < 1.58) = P( 0.9429 Triola,, Essentials of Statistics, Third Edition. Copyright 2008. Pear son Education, Inc. Triola 34 Example: If thermometers have an average (mean) reading of 0 degrees and a standard deviation of 1 degree for freezing water and if one thermometer is randomly selected, find the probability that it reads freezing water is less than 1.58 degrees. µ =0 σ=1 12 P(zz < 1.58) = P( 0.9429 The probability that the chosen thermometer will measure freezing freezing water less than 1.58 degrees is 0.9429. Triola,, Essentials of Statistics, Third Edition. Copyright 2008. Pear son Education, Inc. Triola 35 Example: If thermometers have an average (mean) reading of 0 degrees and a standard deviation of 1 degree for freezing water and if one thermometer is randomly selected, find the probability that it reads freezing water is less than 1.58 degrees. µ =0 σ=1 P(zz < 1.58) = P( 0.9429 94.29% of the thermometers will read freezing water less than 1.58 1.58 degrees. Triola,, Essentials of Statistics, Third Edition. Copyright 2008. Pear son Education, Inc. Triola 36 Example: If we are using the same thermometers, and if one thermometer is randomly selected, find the probability that it reads (at the freezing point of water) above –1.23 degrees. P (z (z > – 1.23) = ? Triola,, Essentials of Statistics, Third Edition. Copyright 2008. Pear son Education, Inc. Triola 37 Example: If we are using the same thermometers, and if one thermometer is randomly selected, find the probability that it reads (at the freezing point of water) above –1.23 degrees. P (z (z > – 1.23) = ? 13 Triola,, Essentials of Statistics, Third Edition. Copyright 2008. Pear son Education, Inc. Triola 38 Example: If we are using the same thermometers, and if one thermometer is randomly selected, find the probability that it reads (at the freezing point of water) above –1.23 degrees. P (z (z > – 1.23) = ? Triola,, Essentials of Statistics, Third Edition. Copyright 2008. Pear son Education, Inc. Triola 39 Example: If we are using the same thermometers, and if one thermometer is randomly selected, find the probability that it reads (at the freezing point of water) above –1.23 degrees. P (z (z > – 1.23) = 0.8907 Triola,, Essentials of Statistics, Third Edition. Copyright 2008. Pear son Education, Inc. Triola 40 Example: If we are using the same thermometers, and if one thermometer is randomly selected, find the probability that it reads (at the freezing point of water) above –1.23 degrees. P (z (z > – 1.23) = 0.8907 14 The probability that the chosen thermometer with a reading above - 1.23 degrees is 0.8907. Triola,, Essentials of Statistics, Third Edition. Copyright 2008. Pear son Education, Inc. Triola 41 Example: If we are using the same thermometers, and if one thermometer is randomly selected, find the probability that it reads (at the freezing point of water) above –1.23 degrees. P (z (z > – 1.23) = 0.8907 The percentage of thermometers with a reading above - 1.23 degrees is 89.07%. Triola,, Essentials of Statistics, Third Edition. Copyright 2008. Pear son Education, Inc. Triola 42 Example: A thermometer is randomly selected. Find the probability that it reads (at the freezing point of water) between –2.00 and 1.50 degrees. Triola,, Essentials of Statistics, Third Edition. Copyright 2008. Pear son Education, Inc. Triola 43 Example: A thermometer is randomly selected. Find the probability that it reads (at the freezing point of water) between –2.00 and 1.50 degrees. P (z (z < – 2.00) = 0.0228 15 Triola,, Essentials of Statistics, Third Edition. Copyright 2008. Pear son Education, Inc. Triola 44 Example: A thermometer is randomly selected. Find the probability that it reads (at the freezing point of water) between –2.00 and 1.50 degrees. P ((zz < – 2.00) = 0.0228 P (z (z < 1.50) = 0.9332 Triola,, Essentials of Statistics, Third Edition. Copyright 2008. Pear son Education, Inc. Triola 45 Example: A thermometer is randomly selected. Find the probability that it reads (at the freezing point of water) between –2.00 and 1.50 degrees. P ((zz < – 2.00) = 0.0228 P (z (z < 1.50) = 0.9332 Triola,, Essentials of Statistics, Third Edition. Copyright 2008. Pear son Education, Inc. Triola 46 Example: A thermometer is randomly selected. Find the probability that it reads (at the freezing point of water) between –2.00 and 1.50 degrees. P (z (z < – 2.00) = 0.0228 P (z (z < 1.50) = 0.9332 P (– (– 2.00 < z < 1.50) = 0.9332 – 0.0228 = 0.9104 Triola,, Essentials of Statistics, Third Edition. Copyright 2008. Pear son Education, Inc. Triola 16 47 Example: A thermometer is randomly selected. Find the probability that it reads (at the freezing point of water) between –2.00 and 1.50 degrees. P (z (z < – 2.00) = 0.0228 P (z (z < 1.50) = 0.9332 P (– (– 2.00 < z < 1.50) = 0.9332 – 0.0228 = 0.9104 The probability that the chosen thermometer has a reading between – 2.00 and 1.50 degrees is 0.9104. Triola,, Essentials of Statistics, Third Edition. Copyright 2008. Pear son Education, Inc. Triola 48 Example: A thermometer is randomly selected. Find the probability that it reads (at the freezing point of water) between –2.00 and 1.50 degrees. P (z (z < – 2.00) = 0.0228 P (z (z < 1.50) = 0.9332 P (– (– 2.00 < z < 1.50) = 0.9332 – 0.0228 = 0.9104 The percentage of thermometers that read between – 2.00 and 1.50 degrees is 91.04%. Triola,, Essentials of Statistics, Third Edition. Copyright 2008. Pear son Education, Inc. Triola 49 The Empirical Rule Standard Normal Distribution: µ = 0 and σ = 1 17 Triola,, Essentials of Statistics, Third Edition. Copyright 2008. Pear son Education, Inc. Triola 50 The Empirical Rule Standard Normal Distribution: µ = 0 and σ = 1 68% within 1 standard deviation x - 1s x x + 1s Triola,, Essentials of Statistics, Third Edition. Copyright 2008. Pear son Education, Inc. Triola 51 The Empirical Rule Standard Normal Distribution: µ = 0 and σ = 1 95% within 2 standard deviations 68% within 1 standard deviation x - x 2s - 1s x + 1s x x + 2s 52 Triola,, Essentials of Statistics, Third Edition. Copyright 2008. Pear son Education, Inc. Triola The Empirical Rule Standard Normal Distribution: µ = 0 and σ = 1 99.7% of data are within 3 standard deviations of the mean 95% within 2 standard deviations 68% within 1 standard deviation 34% 18 34% 2.4% 2.4% 0.1% 0.1% 13.5% x - 3s x - 2s 13.5% x - 1s x x + 1s x + 2s x + 3s Triola,, Essentials of Statistics, Third Edition. Copyright 2008. Pear son Education, Inc. Triola 53 Notation P(a < z < b) denotes the probability that the z score is between a and b Triola,, Essentials of Statistics, Third Edition. Copyright 2008. Pear son Education, Inc. Triola 54 Notation P(a < z < b) denotes the probability that the z score is between a and b P(zz > a) P( denotes the probability that the z score is greater than a Triola,, Essentials of Statistics, Third Edition. Copyright 2008. Pear son Education, Inc. Triola 55 Notation P(a < z < b) denotes the probability that the z score is between a and b 19 P(zz > a) P( denotes the probability that the z score is greater than a P (z (z < a) denotes the probability that the z score is less than a Triola,, Essentials of Statistics, Third Edition. Copyright 2008. Pear son Education, Inc. Triola 56 Notation P(a < z < b) between a and b betweena P(zz > a) P( greater than, at least, more than, not less than P (z (z < a) less than, at most, no more than, not greater than Triola,, Essentials of Statistics, Third Edition. Copyright 2008. Pear son Education, Inc. Triola 57 Triola,, Essentials of Statistics, Third Edition. Copyright 2008. Pear son Education, Inc. Triola 58 20 Triola,, Essentials of Statistics, Third Edition. Copyright 2008. Pear son Education, Inc. Triola 59
