Pictograph Lesson
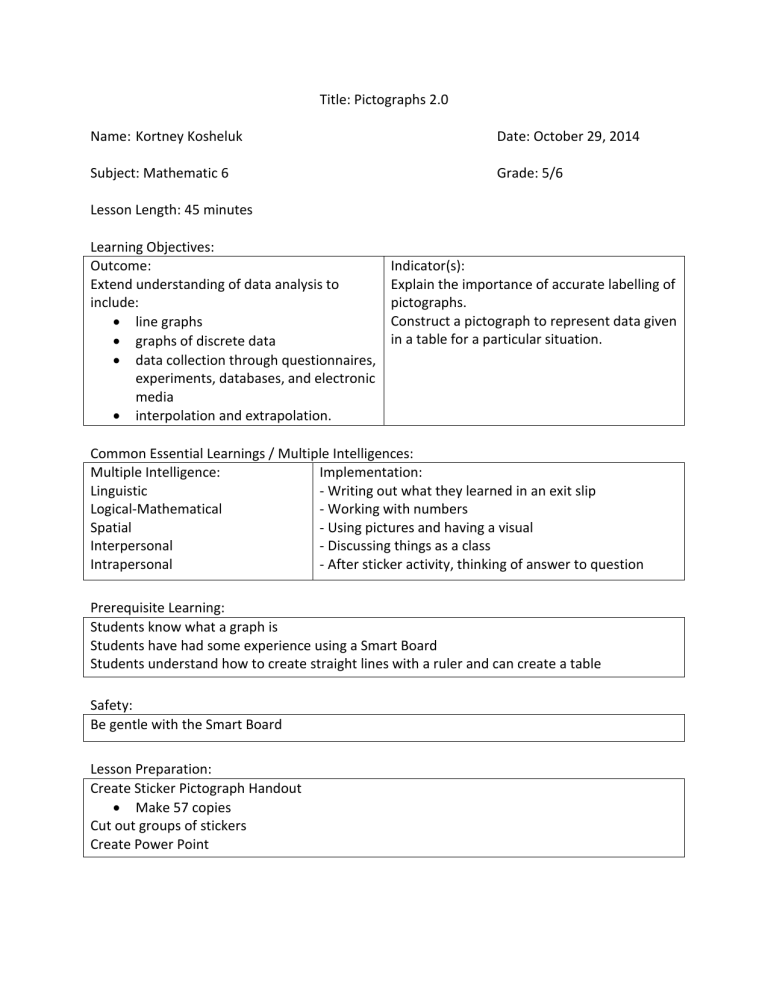
Title: Pictographs 2.0
Name: Kortney Kosheluk
Subject: Mathematic 6
Lesson Length: 45 minutes
Learning Objectives:
Outcome:
Extend understanding of data analysis to include:
line graphs
graphs of discrete data
data collection through questionnaires, experiments, databases, and electronic media
interpolation and extrapolation.
Common Essential Learnings / Multiple Intelligences:
Date: October 29, 2014
Grade: 5/6
Indicator(s):
Explain the importance of accurate labelling of pictographs.
Construct a pictograph to represent data given in a table for a particular situation.
Multiple Intelligence:
Linguistic
Logical-Mathematical
Spatial
Interpersonal
Intrapersonal
Implementation:
- Writing out what they learned in an exit slip
- Working with numbers
- Using pictures and having a visual
- Discussing things as a class
- After sticker activity, thinking of answer to question
Prerequisite Learning:
Students know what a graph is
Students have had some experience using a Smart Board
Students understand how to create straight lines with a ruler and can create a table
Safety:
Be gentle with the Smart Board
Lesson Preparation:
Create Sticker Pictograph Handout
Make 57 copies
Cut out groups of stickers
Create Power Point
Equipment:
Laptop
Projector
Pictograph PowerPoint
White Board
White Board Markers
SmartBoard
57 copies of Sticker Pictograph Handout with stickers
Tub to collect Sticker Pictograph Handouts
57 index cards
Presentation:
Set: 5 minutes
- Do any of you like drawing pictures? Well today you get to do some drawing in math!
- Today we will be learning about pictographs
- What does pictograph mean?
What does pic mean?
What does graph mean?
- A graph where we use pictures!
- What are the 4 parts that are important when making a pictograph?
Title, Label, Symbol, and Key
- Look at Good and Bad Examples
- Do you think we are ready to make our pictographs now?
- There is something else we need to make a pictograph
a table of data
Development: 50 minutes
Smart Board activity 10 minutes
- Let’s try making a pictograph
- What’s the first thing we need to make our graph?
Table of data
- Get students ideas to help make a table of data
If possible do it with flowers, cars, books, or apples.
- Do you think we could put this data in a pictograph?
- Have students come up and fill in the graph
one student each to type in Title, Labels, and Key
get 5 different students to place symbols
Classroom Management Strategies:
- Bring up PowerPoint
Diagnostic Assessment
- Break the word down and see if students can guess
- Make them think
- After they have come up with Title,
Label, Symbol, and Key show slides http://www.softschools.com/math/ data_analysis/pictograph/make_you r_own_pictograph/
- Pull up link on SmartBoard
- write table of data on whiteboard
- Discuss answers before selecting a student to come up and put it in the pictograph
- Do another pictograph like this if students still do not seem comfy
Sticker Pictograph activity 20 minutes
- Explain the handout
put name on it
What happens if there is no name on it?
fill in the pictograph just like we did together
use the stickers instead of drawing!
- Handout Sticker Pictograph activity
- When they are done have them put the handouts in a tub that is on the desk at the front
- When students are done have them think of an answer to the question:
If the key says = 2 lives what happens if you have to record 3 lives in your pictograph?
- When all the students are done discuss this question
Creating their own pictograph with given data 20 mins
- What happens if a pictograph is not labelled correctly?
Garbage, no one can tell anything
- Ask students at random one important thing a
pictograph has to have
- Explain that instead of using stickers you will be drawing the symbols this time.
Do I expect you all to be artists? No, Just make sure it sorta looks like a bone or bottle and that all the symbols are the same
- Have students take out their math notebooks, pencil, ruler, eraser, etc.
- Tell them to make a pictograph from the given data
Dogs
Lady
Tramp
Number of treats given in one week
14
7
Scamp
Angel
Buster
12
10
3
Recycling Bins in the
School
Plastic
Glass
Cans
Boxes
Number of items in them at the end of the day
75
5
20
60
- Get volunteer to help pass out handouts with me
- Go around answering questions
- Have instructions on PowerPoint
- Have question on PowerPoint
Summative Assessment
- Reassure students it’s okay if they aren’t amazing drawers
- Have data on PowerPoint
- Copy table on White Board for homework if they do not finish
Closure: 5 minutes
Exit Slip
- Write at least one thing that you learned today about pictographs on your index card
- When you are done bring your exit slip up to the front and put it in the blue bin on the desk
- Hand out index cards
- Have instructions up on the
PowerPoint as well
Adaptive Dimension:
If students are not comfortable with the idea of pictographs after we do the activity on the
Smart Board have them do one or two more
If the students breeze through the lesson give them more tables of data to create more pictographs
Evaluation:
Diagnostic In the set see how much students know about labelling graphs
Can they guess what a pictograph is?
Summative Creating Their Own Pictographs- Look back in their notebooks. Have they included the Title, Label, Symbols, and Key? Is it legible? Mark out of 5 or 10.
Exit Slips- Mark each index card out of 4
4- Awesome (explanation is more than basic), 3- Good (basic info is given),
2- Needs some work (some information is missing or incorrect), 1- Did not grasp the concept of the assignment (most information is missing and/or incorrect)
Reflection
