goodman_hsph_05_16_05
advertisement
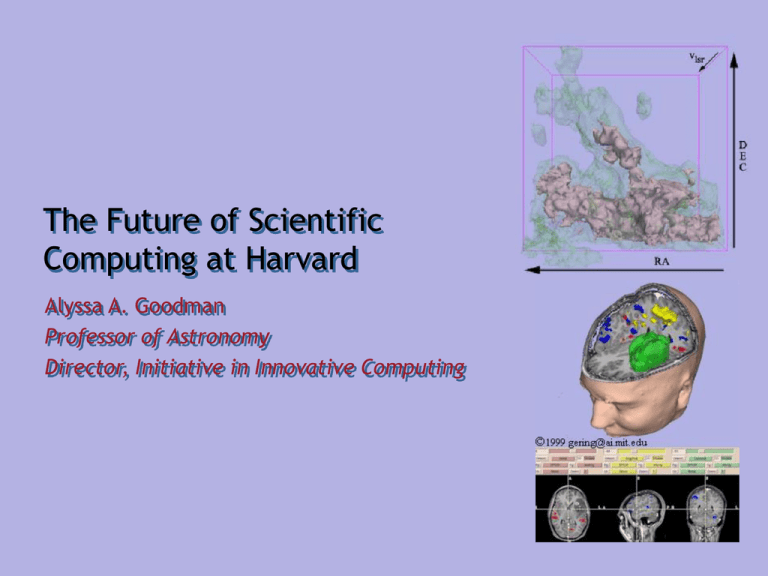
The Future of Scientific Computing at Harvard Alyssa A. Goodman Professor of Astronomy Director, Initiative in Innovative Computing “The Heavy Red Bag” How can computers advance (my) science? A new collaborative scientific initiative at Harvard. Computational challenges are common across scientific disciplines How to: Acquire, transmit, organize, and query new kinds of data? Apply distributed computing resources to solve complex problems? Derive meaningful insight from large datasets? Share, integrate and analyze knowledge across geographically dispersed researchers? Visually represent scientific results so as to maximize understanding? Opportunity to collaborate and apply insights from one field to another Filling the “Gap” between Science and Computer Science Scientific disciplines Computer Science departments Increasingly, core problems in science require computational solution Focused on finding elegant solutions to basic computer science challenges Typically hire/“home grow” computationalists, but often lack the expertise or funding to go beyond the immediate pressing need Often see specific, “applied” problems as outside their interests “Workflow” & “Continuum” Workflow Examples Astronomy Public Health “Collect” Telescope Microscope, Stethoscope, Survey COLLECT “National Virtual Observatory”/ COMPLETE CDC Wonder “Analyze” Study the density structure of a starforming glob of gas Find a link between one factory’s chlorine runoff & disease ANALYZE Study the density structure of all starforming gas in… Study the toxic effects of chlorine runoff in the U.S. “Collaborate” Work with your student COLLABORATE Work with 20 people in 5 countries, in real-time “Respond” Write a paper for a Journal. RESPOND Write a paper, the quantitative results of which are shared globally, digitally. Workflow IIC contact: AG, FAS Workflow a.k.a. The Scientific Method (in the Age of the Age of High-Speed Networks, Fast Processors, Mass Storage, and Miniature Devices) IIC contact: Matt Welsh, FAS Workflow: The Harvard Virtual Brain Establishing a Harvard-wide Neuroscience Infrastructure Data Acquisition MRI PET Microscopy etc. Faculty of Arts and Sciences Harvard College Division of Engineering Distributed Data Storage Harvard School of Public Health Data Processing Analysis Visualization Integration etc. BWH/MGH and UCSD Data Left Hippocampal Volume 6000 Faculty of Medicine Harvard Medical School Affiliated Teaching Hospitals 5000 4000 3000 2000 Information Access Query Statistical Analysis Knowledge Management etc. 1000 0.3 IIC contact: David Kennedy, HMS/MGH 0.4 0.5 0.6 0.7 0.8 0.9 CVLT Discriminability Score 1.0 Harvard IIC New technologies for measurement and simulation are transforming the “workflow.” Biomedicine: pre-genomics Biomedicine: genomics era QuickTime™ and a TIFF (Uncompressed) decompressor are needed to see this picture. • • • • Manual/low throughput Solitary Limited by two hands Analog • • • • High throughput Automated/networked Highly scalable Digital Continuum “Computational Science” Missing at Most Universities “Pure” Discipline Science “Pure” Computer Science (e.g. Galileo) (e.g. Turing) Workflow & Continuum For any particular scientific investigation: Where does, and could, “computational science” make improvements in this cycle? Harvard Public Health “NOW” (Oct. 2004) "In the past, experiments did not involve such large data sets," observed Dyann Wirth, professor of infectious diseases in the Department of Immunology and Infectious Diseases and member of the advisory group for the core. "There has been a dramatic change in the past five to 10 years in the amount and availability of genomic data [or the DNA sequences themselves] and functional genomic data, [or the sequences’ purpose]." In the past five years alone, the genomes of humans, rats, and the malaria parasite Plasmodium Falciparum have been published, for example. "One of the purposes of bioinformatics is to reduce the number of experiments that need to be done to achieve reliable information," said L.J. Wei, professor of biostatistics in the Department of Biostatistics and member of the advisory group for the core. "However, an issue right now is that there are huge data sets that can be run through different kinds of software programs, ending up with many data points. Unless we understand and use bioinformatics well, we may not even know which of those data points are important." Filling the “computational science” gap: IIC Problem-driven approach …focusing effort on solving problems that will have greatest impact & educational value Collaborative projects …combining disciplinary knowledge with computer science expertise Interdisciplinary effort …to ensure that best practices are shared across fields and that new tools and methodologies will be broadly applicable Links with industry …to draw on and learn from experience in applied computation Institutional funding …to ensure effort is directed towards key needs and not driven solely by narrow priorities of funding agencies IIC at Harvard Qui ckTime™ and a TIFF (U ncompr essed) decompressor are needed to see thi s pi cture. QuickTime™ and a TIFF (Uncompressed) decompressor are needed to see this picture. QuickTime™ and a TIFF (Uncompressed) decompressor are needed to see this picture. Numerical Simulation of Star Formation •MHD turbulence gives “t=0” conditions; Jeans mass=1 Msun •50 Msun, 0.38 pc, navg=3 x 10⁵ ptcls/cc •forms ~50 objects •T=10 K •SPH, no B or L, G •movie=1.4 free-fall times Bate, Bonnell & Bromm 2002 (UKAFF) QuickTime™ and a Cinepak decompressor are needed to see this picture. Simulations & Public Health Goal: Statistical Comparison of “Real” and “Synthesized” Star Formation Figure based on work of Padoan, Nordlund, Juvela, et al. Excerpt from realization used in Padoan & Goodman 2002. Measuring Motions: Molecular Line Maps Spectral Line Observations Radio Spectral-line Observations of Interstellar Clouds Radio Spectral-Line Survey Alves, Lada & Lada 1999 Velocity from Spectroscopy Observed Spectrum Telescope Spectrometer 1.5 Intensity 1.0 0.5 0.0 All thanks to Doppler -0.5 100 150 200 250 "Velocity" 300 350 400 Velocity from Spectroscopy Observed Spectrum Telescope Spectrometer 1.5 Intensity 1.0 0.5 0.0 All thanks to Doppler -0.5 100 150 200 250 "Velocity" 300 350 400 QuickTime™ and a TIFF (UncQuickTime™ ompressed) deco andmpre a ssor are needed to see YUV420 codec decompressor this picture. are needed to see this picture. COMPLETE/FCRAO W(13CO) Barnard’s Perseus “Astronomical Medicine” Excerpts from Junior Thesis of Michelle Borkin (Harvard College); IIC Contacts: AG (FAS) & Michael Halle (HMS/BWH/SPL) IC 348 IC 348 “Astronomical Medicine” “Astronomical Medicine” “Astronomical Medicine” Before “Medical Treatment” After “Medical Treatment” 3D Slicer Demo (available after talk) IIC contacts: Michael Halle & Ron Kikinis IIC: Five Research Branches Visualization Distributed Computing Databases/ Provenance Physically meaningful combination of diverse data types. e-Science aspects of large collaborations. Management, and rapid retrieval, of data. Sharing of data and computational resources and tools in real-time. “Research reproducibility” …where did the data come from? How? Analysis & Simulations Development of efficient algorithms. Cross-disciplinary comparative tools (e.g. statistical). Instrumentation Improved data acquisition. Novel hardware approaches (e.g. GPUs, sensors). IIC: Innovative Organizational Model Staffing Highly accomplished academics and senior experts whose careers have been primarily in industry, working together Promotion/ career path Criteria for promotion will give equal weight to scholarly activities, and to technological invention Culture No “class” distinctions made between teaching and nonteaching faculty, scientists and engineers, artists and designers working in the visualization program How IIC will Function: Overview IIC Objectives Project selection Identify and fund projects that are likeliest to have the greatest and broadest impact Project execution Pursue projects in way that will yield best outcome, enable shared learning, etc. Dissemination of knowledge Enable new research for specific scientific discipline Generate new computational tools for broader application Project Selection Project proposals Program Advisory Committee IIC Management Team Who participates Any Harvard researcher (e.g., in genomics, fluid dynamics, epidemiology,neuroscience, nanoscience, comp bio, chemical biology, optics, geology, astronomy, quantum mechanics, et al.) Role Submit proposal in response to call for ideas Harvard researchers representing broad interests of IIC stakeholders plus IIC Director & Dir. of Research Evaluate/rank proposals for scientific merit: should this be a priority for IIC? Consists of • IIC Director • Dirs. of Res. & Adm/Ops • Heads of IIC branches Evaluate/prioritize proposals according to technical feasibility, assess resource needs Project Execution IIC Project Team C, etc. IIC Project TeamManager B Project IIC Project TeamManager A Project Project Manager Discipline scientists Discipline scientists Discipline scientists Scientists who “own” the problem and are committed to working with IIC staff to tackle it Responsible for project execution and metrics for tracking progress/performance; interfaces with IIC branch heads IIC staff IIC staff IIC staff IIC staff scientists assigned to work on project by relevant IIC branch heads. The same IIC staff member may serve on multiple IIC project teams Dissemination of Knowledge Communities of practice • Internal... • External… Seminars/colloquia Publications Knowledge management system • New tools • IIC process • Scientific journals • IIC white papers Education is central to IIC’s mission At Harvard: Undergraduate & graduate courses focused on “data-intensive science” New graduate certificate program, within existing Ph.D. programs Research opportunities at undergraduate, graduate, and postdoctoral levels Beyond Harvard: New museum, highlighting the kind of science done at the IIC IIC organization: research and education Provost Dean, Physical Sciences Assoc Provost IIC Director Dir of Admin & Operations Dir of Research Assoc Dir, Instrumentation Project 1 (Proj Mgr 1) Project 2 (Proj Mgr 2) Project 3 (Proj Mgr 3) Etc. CIO (systems) Knowledge mgmt Assoc Dir, Visualization Assoc Dir, Databases/Data Provenance Assoc Dir, Analysis & Simulation Assoc Dir, Distributed Computing Education & Outreach staff Dir of Education & Outreach IIC: Examples Visualization Distributed Computing Databases/ Provenance Physically meaningful combination of diverse data types. e-Science aspects of large collaborations. Management, and rapid retrieval, of data. Sharing of data and computational resources and tools in real-time. “Research reproducibility” …where did the data come from? How? Analysis & Simulations Development of efficient algorithms. Cross-disciplinary comparative tools (e.g. statistical). Instrumentation Improved data acquisition. Novel hardware approaches (e.g. GPUs, sensors). Visualization: 3D Slicer (BWH Surgical Planning Lab) IIC contacts: Michael Halle & Ron Kikinis “Image and Meaning” (Visualization) QuickTime™ and a Cinepak decompressor are needed to see this picture. QuickTime™ and a Cinepak decompressor are needed to see this picture. IIC contact: Felice Frankel (MIT) Work: Garstecki/Whitesides (FAS) Distributed Computing: Semantics, Ontologies IIC Contact: Tim Clark (HMS/MGH) IIC Contact: Tim Clark (HMS/MGH) Distributed Computing & Large Databases: Large Synoptic Survey Telescope Optimized for time domain scan mode deep mode 7 square degree field 6.5m effective aperture 24th mag in 20 sec > 5 Tbyte/night Real-time analysis Simultaneous multiple science goals IIC contact: Christopher Stubbs (FAS) Astronomy LSST SDSS 2MASS 2011 1998 2001 5000 Peak 500 Avg 8.3 Daily average data rate (TB/day) 20 Annual data store (TB) High Energy Physics DLS BaBar Atlas RHIC 1992 1999 1998 2007 1999 1 1 2.7 60 (zerosuppressd) 6* 540* 120* (’03) 250* (’04) 0.02 0.016 0.008 0.012 0.6 60.0 3 (’03) 10 (’04) 2000 3.6 6 1 0.25 300 7000 200 (’03) 500 (’04) Total data store capacity (TB) 20,000 (10 yrs) 200 24.5 8 2 10,000 100,000 (10 yrs) 10,000 (10 yrs) Peak computational load (GFLOPS) 140,000 100 11 1.00 0.600 2,000 100,000 3,000 Average computational load (GFLOPS) 140,000 10 2 0.700 0.030 2,000 100,000 3,000 Data release delay acceptable 1 day moving 3 months static 2 months 6 months 1 year 6 hrs (trans) 1 yr (static) 1 day (max) <1 hr (typ) Few days 100 days 30 sec none none <1 hour 1 hr none none none TBD 1GHz Xeon 18 450MHz Sparc 28 60-70MHz Sparc 10 500MH z Mixed/ 20GHz/ Pentium/ Pentium 5000 10,000 2500 First year of operation Run-time data rate to storage (MB/sec) Real-time alert of event Type/number of processors MACHO 5 Analysis & Simulations Figure based on work of Padoan, Nordlund, Juvela, et al. Excerpt from realization used in Padoan & Goodman 2002. Analysis & Simulations: Neural Net Models of Intelligence Does Speed of Convergence in Neural Nets Predict Scores on Measures of “General Intelligence”? Network Architecture ¥ (Asymmetric) Fully Connected Networks Π Every node is connected to every other node Π Connection may be excitatory (positive), inhibitory (negative), or irrelevant ( 0). Π Most general Π Symmetric fully connected nets: weights are symmetric ( wij = wji) Input nodes : receive input from the environment Output nodes : send signals to the environment Hidden nodes : no direct interaction to the environment Select from the lower 8 the one that completes the pattern in the top 9 IIC contact: Stephen Kosslyn (Psychology) (Easier) Analysis of Large Data Sets: Mendelian Disease Genes world world world world 189 189 189 189 Hello Hello world 189 world 189 Hello Hello world 189 world 189 reformat, merge, and filter Large data files Can a biologist get from here to there? Without programming? OMIM on the genome 24 23 22 21 20 19 18 17 16 15 14 13 12 11 10 9 8 7 6 5 4 3 2 1 0 Chromosome Hello Hello Hello Hello 0 50 100 150 Position (MB) 200 Location of every known disease gene on the human genome IIC contact: Eitan Rubin (FAS/CGR) 250 Instrumentation IIC contact: Matt Welsh, FAS IIC: Mission The Institute for Innovative Computing (IIC) will make Harvard a world leader in the innovative and creative use of computational resources to address forefront scientific problems. We will focus on developing capabilities that are applicable to multiple disciplines, by undertaking specific, well-defined projects, thereby developing tools and approaches that can be generalized and shared. We will foster the flow of ideas and inventions along the continuum from basic science to scientific computation to computational science to computer science. We will train a next generation of creative and computationally capable scientists, build linkages to industry, and communicate with the public at large. Why Here? Diverse group of senior faculty and accomplished scientists… …spanning a wide range of relevant disciplines, e.g., Computer science Physics, Chemistry, Astronomy, Statistics, Biology, Medicine, etc. Psychology, Graphic Design …with backgrounds in both academia and industry… …deeply committed to the vision of a collaborative approach to solving the most compelling computing challenges facing scientists today

