Participation of women in Victorian local government (Word
advertisement
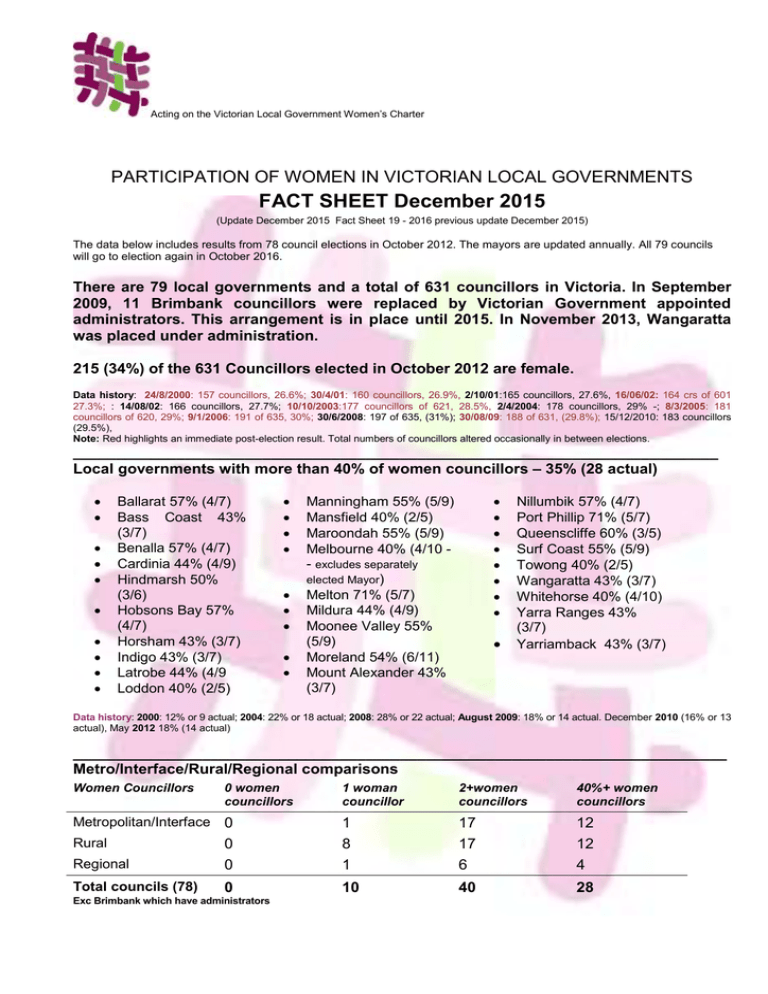
Acting on the Victorian Local Government Women’s Charter PARTICIPATION OF WOMEN IN VICTORIAN LOCAL GOVERNMENTS FACT SHEET December 2015 (Update December 2015 Fact Sheet 19 - 2016 previous update December 2015) The data below includes results from 78 council elections in October 2012. The mayors are updated annually. All 79 councils will go to election again in October 2016. There are 79 local governments and a total of 631 councillors in Victoria. In September 2009, 11 Brimbank councillors were replaced by Victorian Government appointed administrators. This arrangement is in place until 2015. In November 2013, Wangaratta was placed under administration. 215 (34%) of the 631 Councillors elected in October 2012 are female. Data history: 24/8/2000: 157 councillors, 26.6%; 30/4/01: 160 councillors, 26.9%, 2/10/01:165 councillors, 27.6%, 16/06/02: 164 crs of 601 27.3%; : 14/08/02: 166 councillors, 27.7%; 10/10/2003:177 councillors of 621, 28.5%, 2/4/2004: 178 councillors, 29% -; 8/3/2005: 181 councillors of 620, 29%; 9/1/2006: 191 of 635, 30%; 30/6/2008: 197 of 635, (31%); 30/08/09: 188 of 631, (29.8%); 15/12/2010: 183 councillors (29.5%), Note: Red highlights an immediate post-election result. Total numbers of councillors altered occasionally in between elections. ___________________________________________________________________________ Local governments with more than 40% of women councillors – 35% (28 actual) Ballarat 57% (4/7) Bass Coast 43% (3/7) Benalla 57% (4/7) Cardinia 44% (4/9) Hindmarsh 50% (3/6) Hobsons Bay 57% (4/7) Horsham 43% (3/7) Indigo 43% (3/7) Latrobe 44% (4/9 Loddon 40% (2/5) Manningham 55% (5/9) Mansfield 40% (2/5) Maroondah 55% (5/9) Melbourne 40% (4/10 - excludes separately elected Mayor) Melton 71% (5/7) Mildura 44% (4/9) Moonee Valley 55% (5/9) Moreland 54% (6/11) Mount Alexander 43% (3/7) Nillumbik 57% (4/7) Port Phillip 71% (5/7) Queenscliffe 60% (3/5) Surf Coast 55% (5/9) Towong 40% (2/5) Wangaratta 43% (3/7) Whitehorse 40% (4/10) Yarra Ranges 43% (3/7) Yarriamback 43% (3/7) Data history: 2000: 12% or 9 actual; 2004: 22% or 18 actual; 2008: 28% or 22 actual; August 2009: 18% or 14 actual. December 2010 (16% or 13 actual), May 2012 18% (14 actual) ____________________________________________________________________________ Metro/Interface/Rural/Regional comparisons Women Councillors 0 women councillors 1 woman councillor 2+women councillors 40%+ women councillors Regional 0 0 1 8 1 17 17 6 12 12 4 Total councils (78) 0 10 40 28 Metropolitan/Interface 0 Rural Exc Brimbank which have administrators Acting on the Victorian Local Government Women’s Charter Local governments with female mayors elected in 2015/2016 : 34% (27 women mayors) Bass Coast Cardinia Corangamite East Gippsland Gannawarra Hindmarsh Horsham Hume Kingston Manningham Maroondah Melton Mitchell Monash Moonee Valley Moreland Mount Alexander Murrindindi Nillumbik Port Phillip Queenscliffe Strathbogie Surf Coast Warrnambool West Wimmera Wodonga Wyndham Data history: 24/8/2000: 15 mayors, 19%; 2/10/01: 18 mayors, 23%, 14/08/2002: 22 mayors, 28%, 10/10/2003:29 mayors, 37%; 2/4/04: 24 mayors, 30%; 15/12/05: 24, 30%; 9/1/06: 29 mayors 37%, 21/06/07: 20 mayors, 25%; 30/06/08: 19 mayors, 24%, 30/01/09: 20 Mayors 25%, 14/12/09: 16 Mayors, 20% 14/12/10: 18 Mayors 23% 14/12/11: 18 Mayors 23%; December 2011 23% (18 actual); December 2012 : 38% (30 actual) December 2013 25% (20 actual); Dec 2014 38% (30) All councils in Victoria have female councillors, a first for the State. Data history: 2/10/2001: 5 councils 6%, 14/08/2002: 4 councils 5%; 2/4/2004: 5 councils, 6%: 8/3/05: 7 councils 9%; 9/1/2006: 5 councils 6%; January 2008: 4 councils 5%; June 2008: after by-elections, 2 councils 3%; December 2010: 5 local governments (6%) ____________________________________________________________________________ There is only one female councillor in 10 local governments (13%) : Banyule Colac-Otway Gannawarra Hepburn Moorabool Moyne Northern Grampians Pyrenees Swan Hill West Wimmera Data history: 24/8/2000: 24 councils, 30.7%, 2/10/01:21 councils, 27%, 14/08/2002: 23 councils 29%, 10/10/2003: 19 councils 24%; 2/4/2004: 17 councils 21.5%; 9/1/2006: 10 councils 13%; 21/6/07: 11 councils 14%; January 2008: 10 councils 13%; June 2008 after by-elections: 9 councils 11%; December 2010: 14 councils 18%.. * * * * * * * * * * * NEXT COUNCIL ELECTIONS – OCTOBER 2016 Publications available to support women into and on local government councils: A Gender Agenda – kit for women who want to stand for local government and those who want to assist others to stand (4th edition) Now You’re a Councillor www.nyac.org.au website for newly elected women councillors Victorian Local Government Women's Charter - supported by the MAV and the VLGA Enquiries: December 2015 Fact Update 19 Please let us know if there are any errors. This Fact Sheet will be updated in December 2016 (new mayors, new councillors). Linda Bennett VLGA T: (03) 9349 7904 E: linda@vlga.org.au.
