Population Dynamics
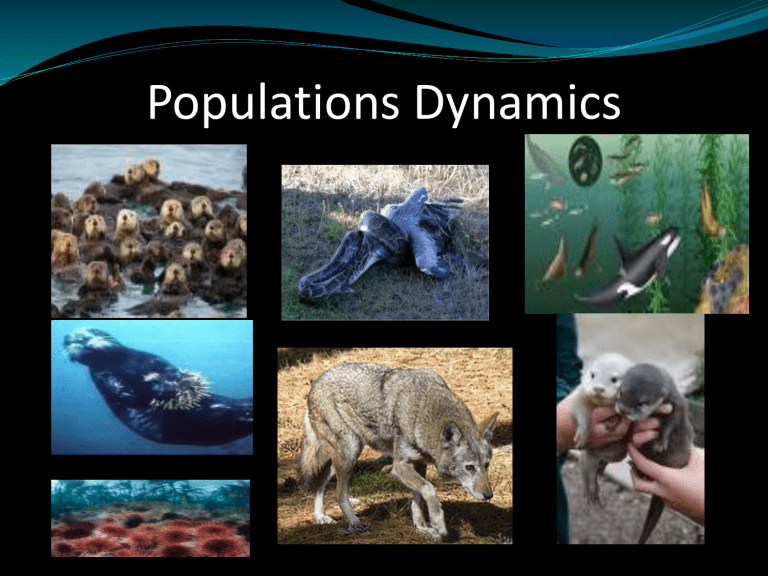
Populations Dynamics
1.
Learning Objectives
What characteristics are used to describe a population?
2.
What factors affect population size?
3.
How is the distribution and abundance of organisms determined by the interactions between organisms and between organisms and the non-living environment?
Population Dynamics
4 main characteristics of populations
1.
2.
3.
4.
Geographic range or patterns of distribution
Population density
Age structure
Population size or # of individuals
Geographic Range or patterns of
1.
distribution
Information ecologists need to study populations
Geographic Range is the area which is inhabited by a species. Ecologists need to determine the geographic range of a species to study its populations.
For instance bacteria in a rotting log may inhabit only a few square centimeters .
Hydrilla is an aquatic plant native to the warmer regions of Asia. The plant was introduced in Florida and is now an invasive species found in many of our lakes, rivers, and spring systems. In fact, the range of this plant has expanded and it is now found in many places throughout the world and United States.
Geographic Range or patterns of distribution
Geographic Range
This map shows the geographic distribution of killer whales. Killer whales move from the coast of
California to the Aleutian Islands
During their migrations.
Geographic Distribution Maps of Pythons invading
Florida help scientists learn about their populations.
Population Density
Information ecologists need to study populations
2. Population Density: The number of individuals of a population in a given area. Population density is the number of individuals in a measurable region.
The members of the population can be spread out or can be clustered throughout the area. Population densities can be small or large.
If there are no limiting factors, population densities can be larger than if limiting factors are present. Limiting factors are things like lack of resources, predators, natural disasters and lack of space.
Population Density
Population Density Equation
Population Density = # of individuals/given area
This saguaro cactus in a desert community has a low density.
There are 4 main characteristics of Populations
Geographic Distribution or Range √
Population Density √
Now we will look at two more characteristics
Age Structure
Population Growth Rate
Age Structure
Age Structure: Age structure diagrams are useful in predicting future population growth rates. Population profiles graph the numbers of individuals in different age groups within a population.
If there are higher numbers of teens, the population will increase in future years!
Population Size or # of individual
Population Growth Rate
Populations can remain constant over time.
Population can increase rapidly over time.
Examples: (1) the Pacific Sea Otters once protected from hunting
(2) the Burmese Pythons in Florida
Populations growth can also see a decrease in size
Example: (1) otter populations can due to predation by killer whales.
(2) Native populations can decrease due to invasive species.
The question arises, how do these types of interacting factors shape and influence population growth?
Three Factors Can Affect Population Size
1. The Number of Births
A population will grow if the births out number the deaths
2. The Number of Deaths
A population will shrink if the deaths out number births
Population Growth Rate
3. The Number of Individuals that Enter ( Immigration ) or that
Leave ( Emigration ) the Population
Immigration: The movement of individuals into an area, which can cause an increase in the population size.
Emigration: The movement of individuals out of an area, which can cause a decrease in the population size.
*Population size will not change and will remain fairly constant, if the birth rate is the same as the death rate AND immigration is the same as emigration.
Some Causes of Immigration and Emigration
Maturity of young = they leave their birth area to seek mates and immigrate to new areas to establish a territory.
Wolves and bears are some examples.
Destruction of habitat = (for example building of a housing development) can cause animals to emigrate from an area and immigrate into an area with intact habitat
Food shortages = they will leave an area and go out searching for food.
Natural disaster = can affect both immigration and emigration rates, as well other limiting factors.
How do we measure growth?
Exponential Growth happens when the individuals in the population reproduce at a constant rate. At first the number of individuals in a growing population increases slowly, but over time the population grows infinitely large. If a population has abundant space and food, and is protected from disease, predators, and natural disasters, the organisms in the population will multiply and increase, thus under ideal conditions, with unlimited resources, a population will grow exponentially.
Exponential Growth Rate Examples….
Growth of Bacterial Population
250000
Bacteria reproduce exponentially.
In just one day millions of bacteria will be produced.
200000
150000
100000
50000
0
1 2 3 4
Time (hours)
Notice the J Shaped Curve
5 6
Logistic Growth
Logistic Growth happens when a population’s growth decreases or ceases following a period of exponential growth.
Imagine a few animals are introduced to a new area plentiful in resources, the growth rate would increase exponentially, but as resources become less available, the growth of a population slows or stops.
Factors that may cause population growth to slow down.
Birthrate decreases, or deathrate increases, or both events occur at the same rate. Immigration rates decrease and the rate of emigration increases, or both.
Logistic Growth continued….
Most normal populations follow a logistic growth curve.
Note that even when the population growth is said to stop, the population is still slightly fluctuating.
Growth levels off as a population reaches what is called the carrying capacity.
Logistic Growth
- - - - - - - - - - -
Carrying Capacity
The carrying capacity represents the largest number of individuals that a given environment can support.
Note the S shaped curve for Logistic Growth
Review of Exponential
& Logistic Growth
( Click on either picture to use an applet simulation of exponential or logistic growth.)
Lesson Overview How Populations Grow
Carrying Capacity
When the birthrate and the death rate are the same , and when immigration equals emigration, population growth stops .
Carrying capacity is the maximum number of individuals of a particular species that a particular environment can support.
.
Once a population reaches the carrying capacity of its environment, a variety of factors act to stabilize it at that size.
It’s your turn to Analyze the Data
Table 1
Days # of Fruit Flies
1. Make a graph utilizing the data in each table. Table 1 will be used to show the growth rate of a fruit fly population. The other graph will utilize data from Table 2 on the next slide to show the growth rate of a populations of rabbits.
5
10
15
20
25
10
100
200
400
600
30 620
Make sure to title your graphs and label the x-axis and the y-axis.
35 640
40 640
Analyzing Data continued….
Table 2
Generations # of Rabbits
2. What type of growth do you find in the fruit fly population? Is it the same type of growth seen in the rabbit population?
1
2
100
105
25 1000
3. Is there a carrying capacity on either graph, and if so, when does the population reach it? What is the maximum number of individuals supported at this time?
37
55
72
1600
2400
3350
86 8000
4. What would happen, if during the rabbits’ 20 th generation, predators moved into the rabbits’ habitat and began eating rabbits?
100 13,150
Here they are again…
The 4 main characteristics of Populations
Geographic Distribution or Range
Population Density
Population Growth Rate
Age Structure
Review of Key Terms
Population Density:
The number of individuals in a given area
Immigration:
The movement of individuals into an area
Emigration:
The movement of individuals out of an area
Exponential Growth:
With unlimited resources, growth can be infinite
Logistic Growth:
Rapid growth followed by growth slowing down
Carrying Capacity:
The maximum number an environment can support
The End
References
Biology by Miller & Levine, Prentice Hall, 2002
Guided Reading and Study Workbook, 2002 http://www.pbs.org/wnet/nature/episodes/invasion-of-the-giantpythons/video-alligator-vs-python/5541/ http://www.otherwise.com/population/
Images from various sources using Google Images doing a search on public domain and royalty free images

