File - Shana M. McDermott, PhD
advertisement
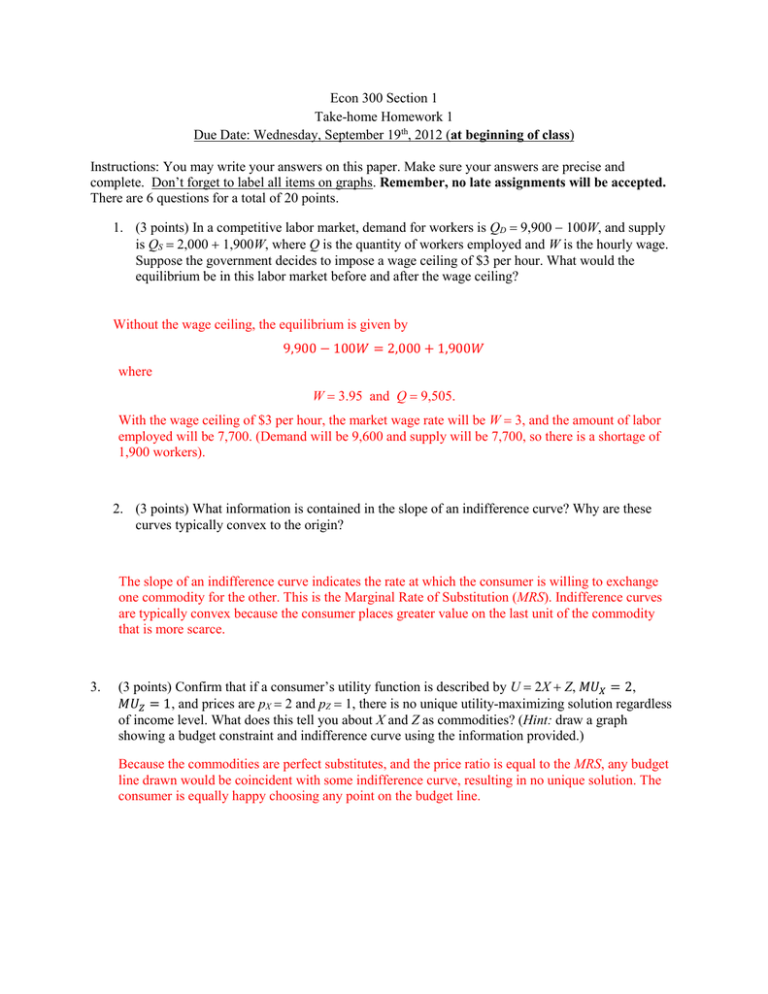
Econ 300 Section 1 Take-home Homework 1 Due Date: Wednesday, September 19th, 2012 (at beginning of class) Instructions: You may write your answers on this paper. Make sure your answers are precise and complete. Don’t forget to label all items on graphs. Remember, no late assignments will be accepted. There are 6 questions for a total of 20 points. 1. (3 points) In a competitive labor market, demand for workers is QD 9,900 100W, and supply is QS 2,000 1,900W, where Q is the quantity of workers employed and W is the hourly wage. Suppose the government decides to impose a wage ceiling of $3 per hour. What would the equilibrium be in this labor market before and after the wage ceiling? Without the wage ceiling, the equilibrium is given by 9,900 − 100𝑊 = 2,000 + 1,900𝑊 where W 3.95 and Q 9,505. With the wage ceiling of $3 per hour, the market wage rate will be W 3, and the amount of labor employed will be 7,700. (Demand will be 9,600 and supply will be 7,700, so there is a shortage of 1,900 workers). 2. (3 points) What information is contained in the slope of an indifference curve? Why are these curves typically convex to the origin? The slope of an indifference curve indicates the rate at which the consumer is willing to exchange one commodity for the other. This is the Marginal Rate of Substitution (MRS). Indifference curves are typically convex because the consumer places greater value on the last unit of the commodity that is more scarce. 3. (3 points) Confirm that if a consumer’s utility function is described by U 2X Z, 𝑀𝑈𝑋 = 2, 𝑀𝑈𝑍 = 1, and prices are pX 2 and pZ 1, there is no unique utility-maximizing solution regardless of income level. What does this tell you about X and Z as commodities? (Hint: draw a graph showing a budget constraint and indifference curve using the information provided.) Because the commodities are perfect substitutes, and the price ratio is equal to the MRS, any budget line drawn would be coincident with some indifference curve, resulting in no unique solution. The consumer is equally happy choosing any point on the budget line. Homework 1 4. (3 points) Suppose Carmela’s income is $100 per week, which she allocates between sandwiches and books. Sandwiches cost $2 each. Books cost $10 each if she purchases between 1 and 5 books. If she purchases more than 5 books in a week, the price falls to $5 for the 6th book and all subsequent books. Draw the budget constraint. Is it possible that Carmela might have more than one utilitymaximizing solution? Because the price of books falls when Carmela purchases more than 5 books in one week, the budget constraint is non-linear. As Figure 4.5 shows, the budget line is kinked at a. This non-linearity makes it possible that a single indifference curve could be tangent to the constraint in two places. In this case, the consumer is indifferent between purchasing 3 books per week at full price and purchasing 10 books per week with the discount. Or 15 intercept, depending on how they interpreted the question. 5. (4 points) Draw a graph with arcade games on the horizontal axis and newspapers on the vertical axis. Joe has $10 per week to allocate between these commodities. The price of newspapers is $0.50. At the initial price for arcade games of $0.25, Joe purchases 10 newspapers and plays 20 games. When the price of games increases to $0.50, Joe purchases 8 newspapers and plays 12 games. When the price of games increases again to $0.75, Joe buys 5 papers and plays 10 games. a. Use this information to draw the utility maximizing points on a graph. b. Draw the price-consumption curve. c. Draw the individual demand curve for arcade games. d. Use the information given to calculate Joe’s elasticity of demand for arcade games between $0.25 and $0.50, and between $0.50 and $0.75. Homework 1 a. b. c. d. See Figure 5.5 See Figure 5.5 See Figure 5.6 1 (8/–0.25)(0.25/20) –0.4 2 (2/–0.25)(0.50/12) –0.3 They may have used the midpoint theorem to calculate the elasticity, which would give an answer of 1 = -0.75 2 -0.45 Figure 5.5 Figure 5.6 Homework 1 6. (4 points) Sarah allocates her income of $5.00 between the consumption of donuts and coffee. Her tastes and preferences are indicated by the indifference curves shown below. The price of donuts is $0.50 each. Initially the price of coffee is $1.00 per cup. Subsequently, the price of coffee falls to $0.50 per cup. On the graph below, show the initial utility-maximizing position, the new utilitymaximizing position, and separate the income and substitution effects. For Sarah, is coffee a normal or inferior good? Their graph should look similar to the graph below:
